Introduction
This paper reports on time series analysis of the persistence of profits of 97 Croatian Companies from 1995 to 2005. This report is unique in the way it is conducted in Croatia. Although, many such researches are conducted in various parts of the US and Europe, a study of this kind is first in Croatia. Croatia, being a part of Yugoslavia until 90’s, is undergoing economic transitions and facing all the perils thereof.
The length of time period is noticeable in the light of the competitive environment hypothesis, which says that the competitive process eliminates all economic profits and losses in the long run. However, the past empirical studies give clear cut evidence for rejecting the same.
A noticeable fact of the research is that it is conducted during a period of economic development of the nation. Croatia won its independence only in the 90’s and its economy was only in developing state. During the years 1990 to 1995, the country was fighting war for its survival with Serbia, and because of prolonged conflicts, the country’s economy was in shambles. It is interesting to see whether there is any change in the profit persistence also. The cut-throat competition emerging in the world market adds to value of the report. In the era of globalization, not that only the domestic firms need to know about the profitability of their economy, but also foreign competitors. Since no past data about persistence of profitability in Croatian economy is available, this report can open the gates for businessmen to explore the untapped potentials of the economy.
Another interesting fact of the research is that it is not the long term established firms that are taken into consideration, but companies that are comparatively young. It is obvious that such emerging ventures needs a research of such kind for future development. The government also can utilize the work for planning and development of their economy.
The main objective of the research is to know about the persistence of the profits of the companies is Croatia over the past nine years and to comment upon the future trends.
The methodology used is similar to one that is used in many previous studies and can be compared with the same. The hypothesis that all long run projected profit rates converge to a common competitive level by restricting all firms to have the same long run projected profit rate. The hypothesis that all long-run projected profit rates are zero. Since the long-run projected profit rate is a ratio of two or more estimated parameters,a test for nonlinear restrictions was used.
The Methodology
The competitive environment hypothesis which states that the competitive process eliminates all economic profits and losses rests mainly upon the following two assumptions:
- If prices are higher than (marginal) costs there will be an added attraction to slash price to enable them to gain the consumers of their competitors and increase market share and profits at their expense. So in any industry profits will not persist where the number of firms is sufficiently large and the concentration sufficiently low.
- Even if the market conditions would allow them to exist, free entry and exit of factors and firms assures that profits (and losses) cannot persist. The contestable market hypothesis states that even monopolists cannot sustain prices greater than average costs when there is truly free entry and exit.
Competitors enter the market and offer similar products at lower prices, reducing the profit margin of the incumbent, when a firm has excess profits and this continues until profitability in that market equals the competitive rate. If firms have profits below average, markets with higher profits are searched by the investors and therefore firms with lower than average profitability are eliminated. This is the basic idea of the competitive market hypotheses: the competitive process eliminates differential profit rates in the long run.
A lot of empirical researches has been undertaken in the past to prove the hypothesis used here. One of the comprehensive works to be cited is the research conducted by Odagiri and Yawawaki (1990a) and Mueller (1990). A total of seven countries (Canada, West Germany, France, Japan, UK and Sweden) were considered. The main conclusion from this research was that for more of these developed economies the competitive environment hypothesis was confirmed, however that for US, 1064-1980 there seemed to be an improvement in competition.
The work by Mueller (1986) examines the profit history of the largest 1000 US Corporations between 1950 – 1972, but failed to find complete empirical support for that period.
Geroski and Jacquemin (1988) used a similar methodology to analyze and develop European Countries: UK, West Germany and France over the period 1049-1977 and reached the conclusion that “France and West Germany were roughly competitive while UK was on Average less so”.
The recent research of Gschwardtner (2003) looks at 187 surviving US firms, from 1950-1999, finds that competitive forces were even not like other to erode profit for time period of 50 years.
Literature review
A competitive market involves a number of firms producing same type of products or providing similar services. Each of the firm in the competitive market is influenced by the other competitors who exist in the market. As there are other firms providing same product or services to the customers, accurate production and marketing techniques is must for being exist in a competitive market. Smaller firms will have to face strong competition from larger ones and they may tend to sell their business to large firm for avoiding the competition.It results in mergers and acquisition in the market which cause further development of the larger firms. This provides them a dominant position in the market.
A competitive market system creates incentives for firms to vie for large market shares. The successful firms acquires a dominant position in the market..Dominance in the market implies power and control. From the firm’s point of view a large market share is good. It creates a real potential to increase profits.From society’s point of view the dominance of a particular firm in the market is not desirable. The firms may utilise these powers for making additional benefit by the exploitation of the society. Thus the competitive market system will helpful to the society to get reduce the exploitation of firms and to get products and services at reduced rate. Competitive markets provide improved goods and services at reduced rate. Hence it is admirable to the customers. The establishment of a healthy and competitive market with high transparency is always benefit to the society
Competitive Priorities
The key to developing an effective operations strategy lies in understanding how to create or add value for customers.Specifically ,value is added through the competitive priority or priorities that are selected to support a given strategy. Skinner and others identified four basic competitive priorities these were cost, quality, delivery, and flexibility. These four priorities translate directly into characteristics that are used to describe various processes by which a company can add value to the products it provides.There now exist a fifth competitive priority – service –and it was the primary way in which companies began to differentiate themselves in the 1990’s
- Cost: – Within every industry, there is usually a segment of the market that buys strictly on the basis of low cost. To successfully compete in this Niche, a firm must necessarily therefore is the low cost producer. But even this doesn’t always guarantee profitability and success.
- Quality: – Quality is two types (a) product quality (b) process quality.The level of quality in a product’s design will vary as to the particular market that it is aimed to serve.
- The goal in establishing the proper level of product quality is to focus on the requirements of the customer’s.Over designed products with too much quality will be viewed as being prohibitively expensive…Under designed products. On the other hand will loss customers to products that cost a little more but are perceived by the customers as offering much greater benefits.
- Delivery: – Another market niche considers speed of delivery to be an important determinant in its purchasing decision. Here the ability of a firm to provide consistent and fast delivery allows it to charge a premium price for its products. In addition to fast delivery, the reliability of the delivery is also important.In other words products should be delivered to customers within variance in delivery times.
- Flexibility: – From a strategic perspective, in terms of how a company competes, flexibility consists of two dimensions, both of which relate directly to how the firm’s processes are designed. One element of flexibility is the firm’s ability to offer its customers a wide variety of products.
The other dimension of flexibility is how fast a company can change its production facilities to produce a new line of products. This dimension is growing in importance as product lifecycle become shorter and shorter.Sony provides good example here with its ability to quickly produce new models of its Walkman.Because it has this high degree of changeover flexibility.Sony is able to easily substitute new Walkman models for those models that do not sell well.
Service:-With product lifecycles becoming shorter and shorter ,the actual products themselves tend to quickly resemble those of other companies.As a consequence ,these products are often viewed as commodities in which price is the primary determinant in deciding which one to buy. A good example of this is the personal computer i9ndustry.Today the differences in the products offered among the different PC manufacturers are relatively in significant, so price is the prime selection criterion.
To obtain an advantage in such a competitive environment firms are now providing value added service. This is true for firms that provide goods and a service.The reason is simple.As Sandra Vandermerwe puts it:” The market power is in the services, because the value is in the results”.
Operations strategy
“To not only survive but also to prosper in today’s fiercely competitive market place strategic business units need to have a successful strategy. In this type of situation Michael Porter, a professor at the Harvard Business school and perhaps today’s leading authority on competitive strategy, believes that there are three generic strategies for succeeding in an industry. Cost leadership, Differentiation and market segmentation. Cost leadership implies that the firm has the ability to successfully under price its competition. Differentiation refers to ways in which an organisation distinguishes its products and services from its competition.For e. g. a company could offer high quality products or services to its customers than its competitors. Market segmentation refers to the focus of the product or services offering on a segment in the market. An. e.g. in the focus of hotel industry would be Toronto based Four Seasons Hotels, which focuses on the luxury end of the lodging business. Porter believes that to be successful, firms have to trade off among the three. In other words a company cannot all things to all people. Other experts on strategy such as Henry Mintzberg of McGill University include cost leadership as a form of differentiation.” (Davis, 31).
The concept of operation strategy plays an important role in determining the overall long term success of an organisation.Developing an operation strategy means looking to new ways to add value for the customers in the goods and services that the firm produces and delivers.Value can have many meanings Managers must therefore align the operations strategy of their firm with the strategies of other functional areas and with the firm’s overall business strategy.
The combination of the globalisation of business coupled with advances in technology has created a hyper –competitive environment in which managers must constantly be looking for new and innovative strategies to stay ahead of the competition. To properly implement these strategies, managers need to clearly understand the core capabilities of their firm and focus their resources on maintaining and improving these capabilities.
Successful firms today are looking to develop strategies that integrate goods and services into a single product offering or bundle of benefits which attempts to solve problems for customers rather than just selling those products.
There are various research work conducted on the subject competitive market hypothesis relating to various fields. The aim of these researches is to identify the specific factors in each competitive market for employed it in the business.
A study conducted by Dragan Matovic on the subject of the competitive market structure of the US lodging industry and its impact on the financial performance of hotel brands is related to this field. The objective of his study was to explore the relationship among various market structure constructs consisting of barriers to entry, competition, growth and market share and their potential impact on financial performance.
The profitability of the hotel industry in USA in the period of his study is showing a recorded growth due to financial or operating efficiency.The average size of hotel brands also showing an increasing trend. Competition in the lodging sector also growing.The dynamics at work within the industry. The research is conducted on the following Does the competitive market structure of the U.S.lodging industry impact the financial performance of hotel brands?” Is there a relationship between a hotel brand’s market share and its financial performance?” Does the competitive market structure of the
U.S. lodging industry impact a hotel brand’s market share? The factors which are taken into consideration is financial performance, market share, competition ,company growth rate ,barriers to entry ,etc.The data is analyzed using the statistical methods such as standard tests, multiple regression analysis. The factors affecting the competitiveness in the industry is studied by the application of statistical methods.
The key findings of the study indicate that the financial performance of hotel brands in the United States is strongly impacted by competitive market structure. Among the various market structure constructs which are analyzed, it is found that the barriers to entry is playing the most dominant role in determining the level of financial performance of hotel brands. Based on a strong negative relationship, barriers to entry are very effective in reducing competition in the U.S. lodging industry. Also, of the constructs studied, barriers to entry had the greatest influence on enhancing the market share of incumbent hotel brands. The growth rate of those incumbent brands has a positive relationship with barriers to entry. As competition intensifies, the growth rate of hotel brands slows down. Increases in competition are negatively correlated with a brand’s market share. Competition has a strong negative relationship with the financial performance of hotel brands. Market share improves as the growth rate of hotel brands increases. As the growth rate of brands increases, profitability also improves. Likewise, improvements in a hotel brand’s market share are positively related to increases in profitability. Lastly, the U.S. lodging market is becoming more competitive, and the industry has reached the mature stage of its lifecycle. (Matovic, 2002).
Technological progress and increased scale economies over time allowed larger organisation to be managed more proficiently relative to small institutions. Improved information processing and telecommunications increased the ability of senior management to oversee larger, more automated operations and advances in applied finance allowed institution to manage the risks of larger port folios more effectively. These technological advances allowed organisation to operate more effectively at multiple locations across greater geographic distances by reducing the costs of monitoring and communicating with staff in distant branch locations. This allowed them to provide higher quality services to customers. Instead the small and less diversified firms are facing keen competitive pressure from the larger firms. The hypothesis is about the performance of larger, multi market firms relative to small single market firms. Technological change may have improved the performance of all categories of firm’s over time and the efficiency hypothesis predicts a greater performance increase for large firms that operate in multiple markets relative to small firms located in single market.
The relative performance of large, multi market firms declined over time relative to small single market firms because the increased managerial rewards and the potential organisational difficulties of managing larger firm’s multi market operations. By using the data from the US banking industry.They apply the regression model in the performance of small single market banks on the local market share of large multi market banks for two time period. They include the shares of large, single market banks and small multi market banks as well. They test the changes in the co efficient in these market shares between the two periods. From the analysis of the data, they find that any improvements in relative performance based on technological progress were more than offset by managerial rewards or organisational diseconomies. So that greater market share of large multi market firms exerted less pressure on small, single market firms.The decrease in competitive pressure on small firms may be of two reasons. First the increase in size and geographic scope of large, multi market firms occurs primarily through mergers and acquisition that create more poorly performing competitors rather than through organic growth that may involve more competition for customers. Second because of a shift in business focus, the level of competition that these banks provide may decrease,.The efficiency hypothesis diminishes the performance of single market firm through both higher costs and reduced revenues. (Berger).
Competition in manufacturing exists because quality and cost are the most important factors to customers.Therefore to maintain a competitive edge in the global market lean manufacturers are continuing to persue quality management practises and approaches for continuous improvement.Universally quality management has often been advocated for the organisations by stressing Total quality management.Lean manufacturing generates impressive performance such as improved management and product quality, increased customer satisfaction ,improved supplier performance ,stronger employee relations and increased return on investment. In order to gain a competitive Advantage in this global economy, it is important for firms to modify the entire structure of production. (Ndahi).
Competitive market analysis is important at every step of any business. Research is absolutely vital to making informed decisions in business. The consideration of followings is essential for the research.
- The major competitors in the market.
- The current market share of each firm in the market.
- The significant changes in the market share of each competitive firm in previous years.
- The strategy adopted by firms to achieve the market share.
The analysis of these factors will help a firm to formulate appropriate policies for introducing in the market. The existing trend in the market is required to be analysed for taking correct decision. The decision making of firm will depend on the existing competitive factors in the market. It is essential for firms to get adequate information regarding these factors for maintaining the growth and profitability in their business.
The main objective of the research on competitive market hypothesis is to identify the factors which are playing dominant role in the competitive market. How can a firm can successfully compete with other firms in the competitive market is required to be find out by the analysis. The matters that affecting the profit and growth rate of firms will have to be analysis
Methodology
Regression analysis model is a dependable method for the analysis of the competitive market hypothesis, which is most often used for prediction. The goal of this analysis is to create a mathematical model that can be used to predict the values of a dependant variable based upon the values of an independent variable. In other words the model is used to predict the value of Y when the value X is known, the value of dependant variable is predicted from the known value of the independent variable.correlation analysis is often used with regression analysis because correlation analysis is used to measure the strength of association between the two variables X and Y. There are two types of regression analysis which are linear regression and non linear regression. Regression line is a line drawn through a scatter plot of two variables.
Regression analysis is a statistical method where the mean of one or more random variables is predicted based on other measured random variables.Linear regression is also used for the identification of the profitable firms by the analysis of Lambda constant of the firms. It helps to identify the rate of firms which are expecting to achieve the average profit in their previous years.
Competitive market analysis is the collection, analysis and interpretation of real world data to yield a deep and thorough understanding of the characteristics and dynamics of the customers and competitors within a market place. For informing the clients and help them to take fact based decisions regarding potential issues and opportunities by providing insight into the nature of the strategic field, the hypothesis is used.
Regression analysis is used here for the study. Regression analysis is a method used to determine the values of parameters for a function that cause the function to best fit a set of data observations provided. In Linear regression, the function is a linear or straight –line equation.The changes in the value of one variable i.e. dependant variables, by a function of the other variables i.e. Independent variable is shown by linear regression. Hence there are two types of variable required for regression analysis. Dependant and Independent variable.The changes in the value of one variable result in the changes in other variable then it is said that the latter variable is a dependant variable to the former one. For example the yield in agriculture depends upon monsoon and temperature… Here yield is a dependant variable where as monsoon and temperature is independent variables.
Regression analysis helps to predict the out come of a given key business indicator (dependant variable )based on the interactions of other related business factors (explanatory variables ).It is a statistical forecasting model that is concerned with describing and evaluating the relationship between a given variable (i.e. dependant variable )and one or more other variables.(i.e. independent variables ).These models can be used to predict the value of one variable from one or more other variables whose value can be predetermined. (Regression Analysis).
Line of best fit or regression line is a graphic technique to show the functional relation between the dependant variable and the independent variables. When the given bivariate data are plotted on a graph a scatter diagram will get. If the points of the scatter diagram are concentrate around a straight line that line is called the line of best fit. Thus the line of best fit is that line which is closer to the points of the scatter diagram.This line shows the average relation between the variables. In regression analysis regression line is drawn for the simplification of the analysed result. Regression line is a line drawn through a scatter plot of two variables.The line is chosen so that it comes as close to the points as possible.The scatter plot of the variable helps us to visually inspect the data prior to running a regression analysis.This allows to see if the relationship between the two variables is increasing or decreasing and gives only a rough idea of the relation ship.The simplest relation between two variable is a straight line or linear relationship. In case of curvy Linear A different model have to be used for describing the relationship.Simple linear regression analysis finds the straight line that best fits the data.
Regression analysis involves fitting a model with both deterministic and stochastic components. The deterministic component is called the predictor and the stochastic component is called the error term. In its simplest form the analysis model contains a dependant variable also called the Y variable and a single independent variable also called the X variable.
Simple linear model represents the dependant variable, Yi, as a linear function of one independent variable, Xi, subject to a random disturbance or error. (Linear Relationship).
The least squares method of regression
It is a method of drawing the regression line by the application of the least square principles. The principle of least squares is that principle which states that the line of best fit should be drawn in such a manner that the sum of the squares of difference between the known values of the dependant variable and the corresponding values of it obtained from the line of best fit should be the least. i.e.∑(Y0 – Ye )2 should be the least where Y0 stands for known or given values of dependant variable and Ye stands for the corresponding value of the dependant variable obtained from the line.
Each of the data points is represented by an X and a Y. Each point of the best fit line is represented by an X and an Yhat. The data points don’t always fall exactly on the best fit line and, therefore, Y does not always equal Yhat. The least squares method uses the vertical deviation of each data point from the best fit line (i.e. the deviation denoted as Y – Yhat). The best fit line results when there is the smallest value for the sum of the squares of the deviations between Y and Yhat.
Error sum of squares
This method produces the best line possible given the fact that there is only a subset of all possible data. For finding the best fit line the equation for this line has to be finding out. To do that it need to know the slope and the Y-intercept. These parameters have to be estimated from the subset of the data (i.e. the more complete the data set, the better the estimates). To estimate these parameters, follow the sets below:
- Arrange the data into X, Y pairs (as in the bird data table above).
- Compute the mean of all of the X values.
- Compute the sum of the X2 by squaring each value of X and adding the squares.
- Compute the sum of the Y2 in the same manner.
- Compute the sum of each X value multiplied by its corresponding Y value.
- Calculate the slope (b) of the line as:
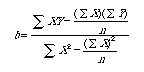
- Place the slope and Y-intercept values into the equation for a line.
Correlation analysis also used to measure the degree of association between two variables. The correlation coefficient is calculated by the formula as follows
The correlation coefficient is unit les and between +1 and _ 1.In general the closer the correlation coefficient is to +1 or _1 the better the association between the two variables X and Y. (Linear Regression: Introduction to Simple Linear Regression).
Explanation of variables
The variables used here are the profit figures of 97 Big Croatian companies over the period of past 9 years which is abstracted from Amadeus database. From these firms’ profit figures we have to identify the firms which are expecting to achieve profit above the average profit earned by these firms in previous years.By the application of regression model on these variables we can achieve this object. It is expecting that the trend of profit earning rate shown by firms will be continued in coming years.
The estimation of long run projected profits of each firm can be calculated by the finding the constant and coefficient estimates of each firm. The term lambda is used to indicate the projected profit rate of each firm. If the value of lambda of a firm is more than zero it is said that the expecting profit rate of that firm will be more than the average profit earned by it in previous years. If the lambda is less than zero it indicates the firm’s expecting profit will be less than the average profit earned by it in previous years. Hence by finding the lambda value it is easy to identify those firms that will earn a profit above the average profit level earned by them in previous years. For getting accurate results the data variables used for the study must be proper and relate to actual working results of the firms. The accuracy and reliability of the data is important.
Alpha and beta are the key components used here for the analysis. These components are widely used in evaluating portfolio analysis. The alpha co efficient is the return of the portfolio over and above the return of the index. The alpha of the market must be 0.The beta co-efficient above 1.0 means that the port folio swings more aggressively than the market.if the Beta is less than 1.0 ,the port folio moves less than the market. A negative beta means that the port folio moves in the opposite direction as the market. The Beta of the market must be 1.
R2, a measure of goodness of fit of linear regression
R2 is a statistic that provides information about the goodness of fit of a model.In regression the R2 coefficient of determination is a statistical measure of how well the regression line approximates the real figures.
The value R2 is a fraction between 0.0and 1.0, and has no units. An R2 value of 0.0 means that the X variable is not related to the Y variable and hence the prediction becomes impossible. There is no linear relation between X and Y and the best fit line is a horizontal line going through the mean of all Y values When R2 equals 1.0 all points lie exactly on a straight line with no scatter. It indicates that the regression line perfectly fits the data. (Linear Regression: Introduction to Linear Regression).Findings and analysis
The analysis of the profit figures of the firms that will earn profit below or above the average profit in the previous years is done through the finding of lambda constant..The lambda of each firm is taken for the analysis.The hypothesis is that the firm which has the lambda value below zero is considered as below average profit earning company and the firm occupy above zero lambda value is considered as earning profit above the average profit of the firm in the previous years. There is a direct relation between the lambda and expecting profit. If the lambda is high it is an indication of high profit growth of the firm.if the lambda is low or less than zero it is an indication of the declining profitability of the firm in future.
Results
From the analysis of the data of 97 Croatian Companies ,it is clear that lambda of 53 companies is above zero.It can interpret that among 97 Croatian companies taken for study , 53 companies will earn a profit above the average profit of the firms in the previous years.The remaining 44 companies ‘lambda is below zero which indicates that the expecting profit of them are below the average profit rate of the firms in the previous years.In short 54.63% of the analysed 97 companies will earn a profit above the average profit and the remaining 45.36% of the firms expecting profit is below the average level. The profit rates of most of the firms are showing a trend of decline due to the competition in the market. Only highly efficient firms can earn profit more than the average level in the highly competitive market. The trend in the profit rate of firm is a reflection of the growth of the industry. A developing industry can ensure regular growth of firms in that industry. Hence in a matured industry most of the firms are showing a standing or declining trend in their growth and profit. Thus the results get from data analysis will be connected with the industry growth level in which the firms existing.
Conclusion
The study of the competitive market hypothesis by way of regression model reveals that there is a direct relation between the firm’s growth rate and the competitive factors in the specific industry. The trend in the profit rate of the firms will have to continue in future also in a competitive market. The firms are really struggling for existence and the profit matter is only after their existence. The profitability of firms depends its ability to change continually to meet the changing needs of the society. Only an experienced firm can forecast the change that have to taken place in future. The forecasting of future need of society is essential for the existence and growth of the firms in this changing world. The taste and need of customers are changing continually. The firms want to forecast these changes for modifying their existing product and services. It is said that today’s growth products may be tomorrow’s earthen pots.
The growth stage of the industry will affect the profitability of the firms in the industry.
The identification of the profitable firms is useful for knowing the industrial growth.The analysis of the previous data of the firms regarding the profit and growth will helps to know how much firms can achieve their projected growth and profitability in their business. The regression model is highly helpful for the estimation of the profitable firms in a particular industry. The research work may be affected by the time variable. The data obtained for the research is not adequate. Detailed information about the financial position of firms is not available for discussion.
.it is presumed that the trend of the given values in the data will continue in future also. But this need not always happen.The analysis is based on the data and variable in the previous years. The accuracy and reliability of the estimation may be affected by the data used for the study.By considering these limitations it is an accepted model for data analysis.
The regression analysis has revealed that 44 out of 97 Croatian companies will make less profit for the current year with respect to average profit for the last year. These companies have to identify their core competency and concentrated on competitive priorities of cost, quality, delivery, flexibility and service, so that their losses will be minimised and they can make profit in the coming years. The examples of companies that have successfully developed competitive priority are given below.
Example1
In August 2003, Toyota unveiled a system connecting dealers and factories that allow customers to pick the colour and options on cars built at its four North American plants and have the vehicle delivered in two weeks. This is faster than many of its competitors and an advantage in this age of instant gratification. An added benefit is that dealers have a smaller inventory of cars.
This is one illustration of how times have changed in the automobile industry. In the early days Henry Ford was reputed to have said that a customer could have any colour car that they wanted so long as it was black. To day the models and possible options are mind boggling.Of course, such a broad selection means that anyone model may have to be made in smaller production runs to respond to demand. This is monumental task for an industry using inflexible mass production techniques, but necessary as Daimler Chrysler found out.Daimler Chrysler had to forego millions of dollars when sales of the PT Cruiser soared and exceeded dedicated assembly line factory capacity.
Honda provides a good example of how flexibility can be implemented.On the same assembly line, Honda’s factory in Alliston, Ontario, turns out the Odyssey minivan and the Pilot SUV for the Honda brand and the MDX SUV for the luxury Acura line. In fact it can manufacture any vehicle based on the mid- sized Accord, making it a flexible assembly line. Honda also has a plant in Alabama that is a carbon copy of the Alliston plant. This allows Honda the operational flexibility to respond quickly to demand. This is no wonder that the other carmakers are following suit. The automakers achieve this flexibility through technology, lean manufacturing, and well trained employees. This is an example of the importance of operations in ensuring that products and services that customers really want are delivered on time without incurring excessive costs.
Example 2
The Canadian steel making industry increasingly facing competition from steel makers in developing countries such as Brazil, China, and India where labour costs are low. While some other steel makers struggle, Hamilton based Dofasco, in business since 1912, has turned around its losses from a decade ago through a revised strategy. The company also owns or has partial ownership in facilities in the USA and Mexico.
Until the late 1980s, the company competed on price by producing as much steel as possible at the lowest possible prices. However by the early 1990s increased competition resulted in Dofasco not being able to compete profitably. As a result, by 1992 it found itself in debt and losing money.
Realising that current competing on cost strategy (cost leadership) was untenable.Dofasco refocused its strategy to developing new and innovative products and to providing its customers with solutions for high quality and specialised applications ( product differentiation ).The business strategy was called Solutions in Steel and focused on operational excellence ,technology and innovation ,and intimate customer relationships. By 1999, it was the most profitable steel producer in North America.In 2000 it was ranked first in North America among thirty steel suppliers in independent customer satisfaction survey and was rated one of the best Canadian companies to work for by Report on Business Magazine.
To take to effect a successful transition from the old strategy to the new, they reduce the work force from about 13000 to 7000. It spends considerable sums on research and development and facility upgrades.Dofasco recognised that employees would be critical to success in such a strategy. Thus employees were provided with a variety of training and development opportunities.In addition the company invested in health ,safety and wellness in the work place such that in 2002 the national quality institutes awarded Dofasco a Canadian Award for Excellence Healthy Work place Trophy.Studies have shown that investing in health, safety and wellness in the work place can improve productivity and lower costs.Quality at Defasco has meant paying attention to environmental concerns also.The company’s environmental management systems comply with an international set of environmental standards..
Example 3
Zara ,a retail chain of high fashion boutique clothing stores ,has grown rapidly since Amancio Ortega opened his first store in Spain in 1975.Headquartered in Northern Spain ,Zara with more than 400 retail stores in 25 countries ,now generate sales of more than $ 3 billion annually primarily in Europe ,but is now beginning to penetrate the Canadian market with nine stores ,the reasons for its success are attributed to several factors including low prices ,speed of delivery ,and flexibility.Merchandise is delivered to each Zara retail location twice a week. This fast and almost continuous replenishment concept reduces the need for significant in store inventories and the possibility of clothes going out of fashion.
A major factor in Zara’s capability to react quickly to changes in the customer buying behaviour is its use of information and technology. Sales people in each retail location use handheld computers to record buyer preferences and trends.This information along with actual data of sales are transmitted daily through the internet to Zara’s Headquarters in Spain. In addition unlike its major competitors, which outsource manufacturing, Zara produces most of its merchandise in its state-of –the-art factory in Spain. Products are designed, produced and delivered to its stores in as little as two weeks after they have appeared for the first time in a fashion show in place their competitors took more than five weeks.
We will analyse how the competitive marketing hypothesis was successfully implemented in the above three examples.
Toyota &Honda (car manufacturers), Dofasco (Canadian steel manufacturers), Zara (Spanish High fashion boutique clothing company).They all resorted to regression analysis for projecting their profit which showed a down ward trend due to high competition from the newly industrialised nations.So they redefined their operation strategy to cope with the new environment.
Toyota unveiled a system connecting dealers and factories and introduced just in time, zero inventories for their sub contractors. This gave them a cost advantage and fast delivery over their competitor’s.Honda provides a good example of flexibility in providing a variety to their customers.
The Canadian Steel Manufacturer, Dofasco found that cost leadership was untenable so they developed new and innovative product.This is a successful example of product differentiation Zara, the Spanish boutique clothing store excelled in price, speed, flexibility and service. They reacted quickly to changes in the customer buying behaviour.
The 97 Croatian companies resorted to regression analysis to project their profit and found that 44companies would make a profit less than their average profit in previous year’s.So they streamlined their operation strategy to enhance their profit margin by focusing on cost, quality, delivery, flexibility and service.
The market place dictated that for firms to be successful, they had to produce reasonably priced customarised products of high quality that could be quickly delivered to the customers. It was difficult for the management to focus on all the five aspects simultaneously. So they had to decide which priorities were critical to the firm’s success and then concentrate or focus the resources of the firm on those particular characteristics. The core capability of the firm was a critical factor in making this selection.
Works Cited
Berger, Allen N. Competition from Large, Multimarket Firms and the Performance of Small, Single -Market n Firms: Evidence from Banking Industry. Questia.com. 2007. Web.
Davis, Mark M. FUNDAMENTALS OF OPERATION MANAGEMENT. 1st Edition. McGraw Hill Ryerson, 2005, P. 31.
Linear Relationship. Investopedia. 2008. Web.
Linear Regression: Introduction to Simple Linear Regression. 2008. Web.
Linear Regression: Introduction to Linear Regression. GraphPad Software. 1999. Web.
Matovic, Dragon. The Competitive Market Structure of the US Lodging Industry and its Impact on the Financial Performance of Hotel Brands. 2002. Web.
Ndahi, Hassan b. Learn Manufacturing in a Competitive Market. Questia.com. 2008. Web.
Regression Analysis. Value Based Management.net. 2008. Web.