Introduction
In the medical sphere, cancer studies are one of the most important and necessary specialties. For millions of cancer patients around the world, life is a continued fight for survival. With the evolution of medical technology, diagnostics, care, and treatment, it has become possible to significantly improve the lives of people with cancer. Both complete elimination of cancer from the body and treatments aimed at alleviating its symptoms have become more widespread, helping people live richer lives. Among different types of cancer, breast cancer is well known and often recorded in women. A number of treatments are available for breast cancer, including medication and chemotherapy. In order to understand the effectiveness of various medical approaches, it is necessary to also determine the survival rate of breast cancer patients over the years. Cancer develops with time, meaning that later stages of the disease exhibit considerably lower survival rates among the population. In order to demonstrate this tendency visually, I am performing a survival analysis. It is possible to interpret existing numerical data in a visual format, where trends for survival are clearly visible.
Interpretation

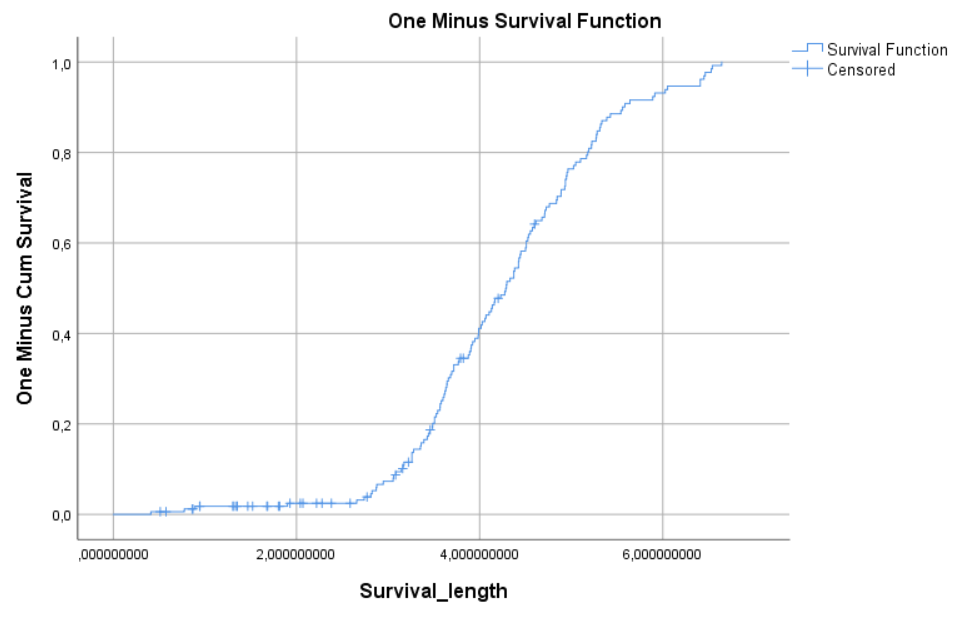
Inputting the data into SPSS, I was able to produce a graph of patient survival rates over a period of 7 years. The survival graph can be used as a tool for analyzing group mortality or the effect of certain conditions on the survival of patients (Zahid, 2019). From the changes in the curve, it can be seen that the amount of individuals living for longer than 3 years and dying is significantly lower than those dying early on during the recorded period. These trends can indicate the existence of a good cancer patient support system. In addition, these observations fall in line with the general trends regarding breast cancer survival. Over a 10-year period, more than 80% of breast cancer patients survive (“Breast cancer – Statistics,” 2021). This graph can be used to discuss the need for early cancer prevention and treatment.
Conclusion
As a result of this analysis, data was obtained regarding the survival rates of breast cancer patients. Inputting data into SPSS and performing a Kaplan-Meier-type analysis, this work has obtained a graph displaying patient survival timelines. Contrasting survival time with the occurrence of death, a general trend was established. It is possible to observe existing tendencies within a limited observation group. Most patients who died have had considerably low survival times, highlighting a disparity between them and those who have lived for up to 7 years. As highlighted by other types of research, most people with breast cancer are able to live long lives if they receive adequate treatment in a timely manner. Similarly, a sharp drop-off in deaths signifies a more stable condition of cancer. The difference can be used to argue about the need for early cancer treatment, prevention, and surgery, which all exist as necessary tools to combat the condition (Guerini-Rocco et al., 2021). A lack of action during the early development periods is often conducive to a worse quality of life, life expectancy, and life satisfaction. In order to promote the well-being and health of cancer patients, it is necessary for doctors to take an active part in cancer screenings, diagnostics, and treatment. Furthermore, it is vital to raise more awareness about the implications of breast cancer. Early response has been statistically shown to make a large impact on the continued well-being of breast cancer sufferers.
References
Breast cancer – Statistics. (2021). Cancer.Net. Web.
Guerini-Rocco, E., Botti, G., Foschini, M. P., Marchiò, C., Mastropasqua, M. G., Perrone, G., Roz, E., Santinelli, A., Sassi, I., Galimberti, V., Gianni, L., & Viale, G. (2021). Role and evaluation of pathologic response in early breast cancer specimens after neoadjuvant therapy: Consensus statement. Tumori Journal, 030089162110626. Web.
Zahid, T. (2019). Survival Analysis — Part a. Medium. Web.