Operation in a Free-For-Service Environment
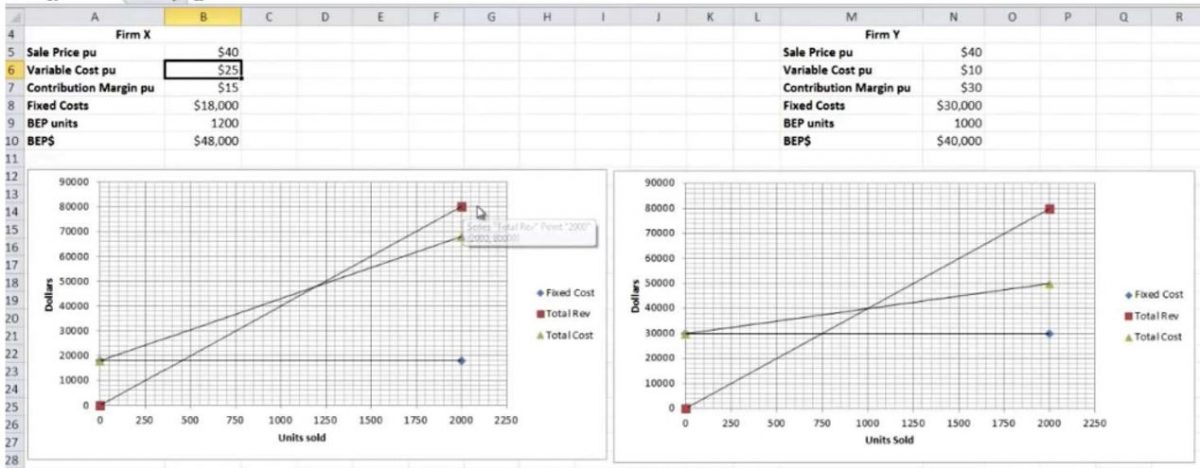
The fixed costs would increase for both firm X and Y since the services are provided based on the fixed charge for a given period (Obadha, Kazungu, Chuma, & Barasa, 2018). The total revenue curve would shift to shift upwards, depending on the fixed value of services provided after, or during the sales of goods. In this case, the value charged for the services is constant, regardless of the number of units sold. The total cost’s curve would also shift upwards and adopt a reduced gradient, due to the fixed charges for any services rendered after the sales of goods. The break-even point would therefore shift due to the general upwards shift of the total revenue and total cost curves.
Operation in a Capitalized Environment
In a capitalized environment, payment for the services varies depending on the volume of sales (Spector & Studebaker, 2015). Therefore, the fixed cost curve would move downwards for both firm X and Y. The total cost curve would shift downwards and with a reduced gradient, since in a capitalized payment system expenditure is minimized, with the maximization of revenue. The total revenue curves for firms X and Y would, therefore, shift upwards with an increased gradient, since the value of revenue is dependent on the volume of sales. There would be an attempt by the firms to adopt vigorous sales promotion activities, as a strategy for enhancing the volume of sales. The break-even point for both companies would move upwards and towards the left.
Provider in the Best Position to Grow Business
Firm Y is in the best position to grow, due to the relatively low variable cost, and high fixed costs (Obadha, Kazungu, Chuma, & Barasa, 2018). Therefore, the company can yield revenue even during the low seasons of business. The low variable cost also reduces financial risks due to low sales.
References
Obadha, M., Kazungu, J., Chuma, J., & Barasa, E. (2018). Health care purchasing in Kenya: Experiences of health care providers with capitation and fee-for-service provider payment mechanisms. International Journal of Health Planning and Management, 34(8). Web.
Spector, J., & Studebaker, B. (2015). Provider payment arrangements, provider risk, and their relationship with the cost of health care. Society of Actuaries.