Introduction
In their cross-sectional research, Pal et al. (2021) measured more than 1,300 U.S. health professionals’ hesitancy to COVID-19 vaccines and explored the hesitant and non-hesitant subgroups’ levels of trust in the healthcare system. According to anonymous surveys, vaccine hesitancy was noted in less than 8% of the respondents (Pal et al., 2021). Between 45% and 50% of the hesitant group expressed distrust toward regulators and pharmaceutical businesses, and age and educational levels were negatively correlated with hesitancy (Pal et al., 2021).
Graph

Discussion
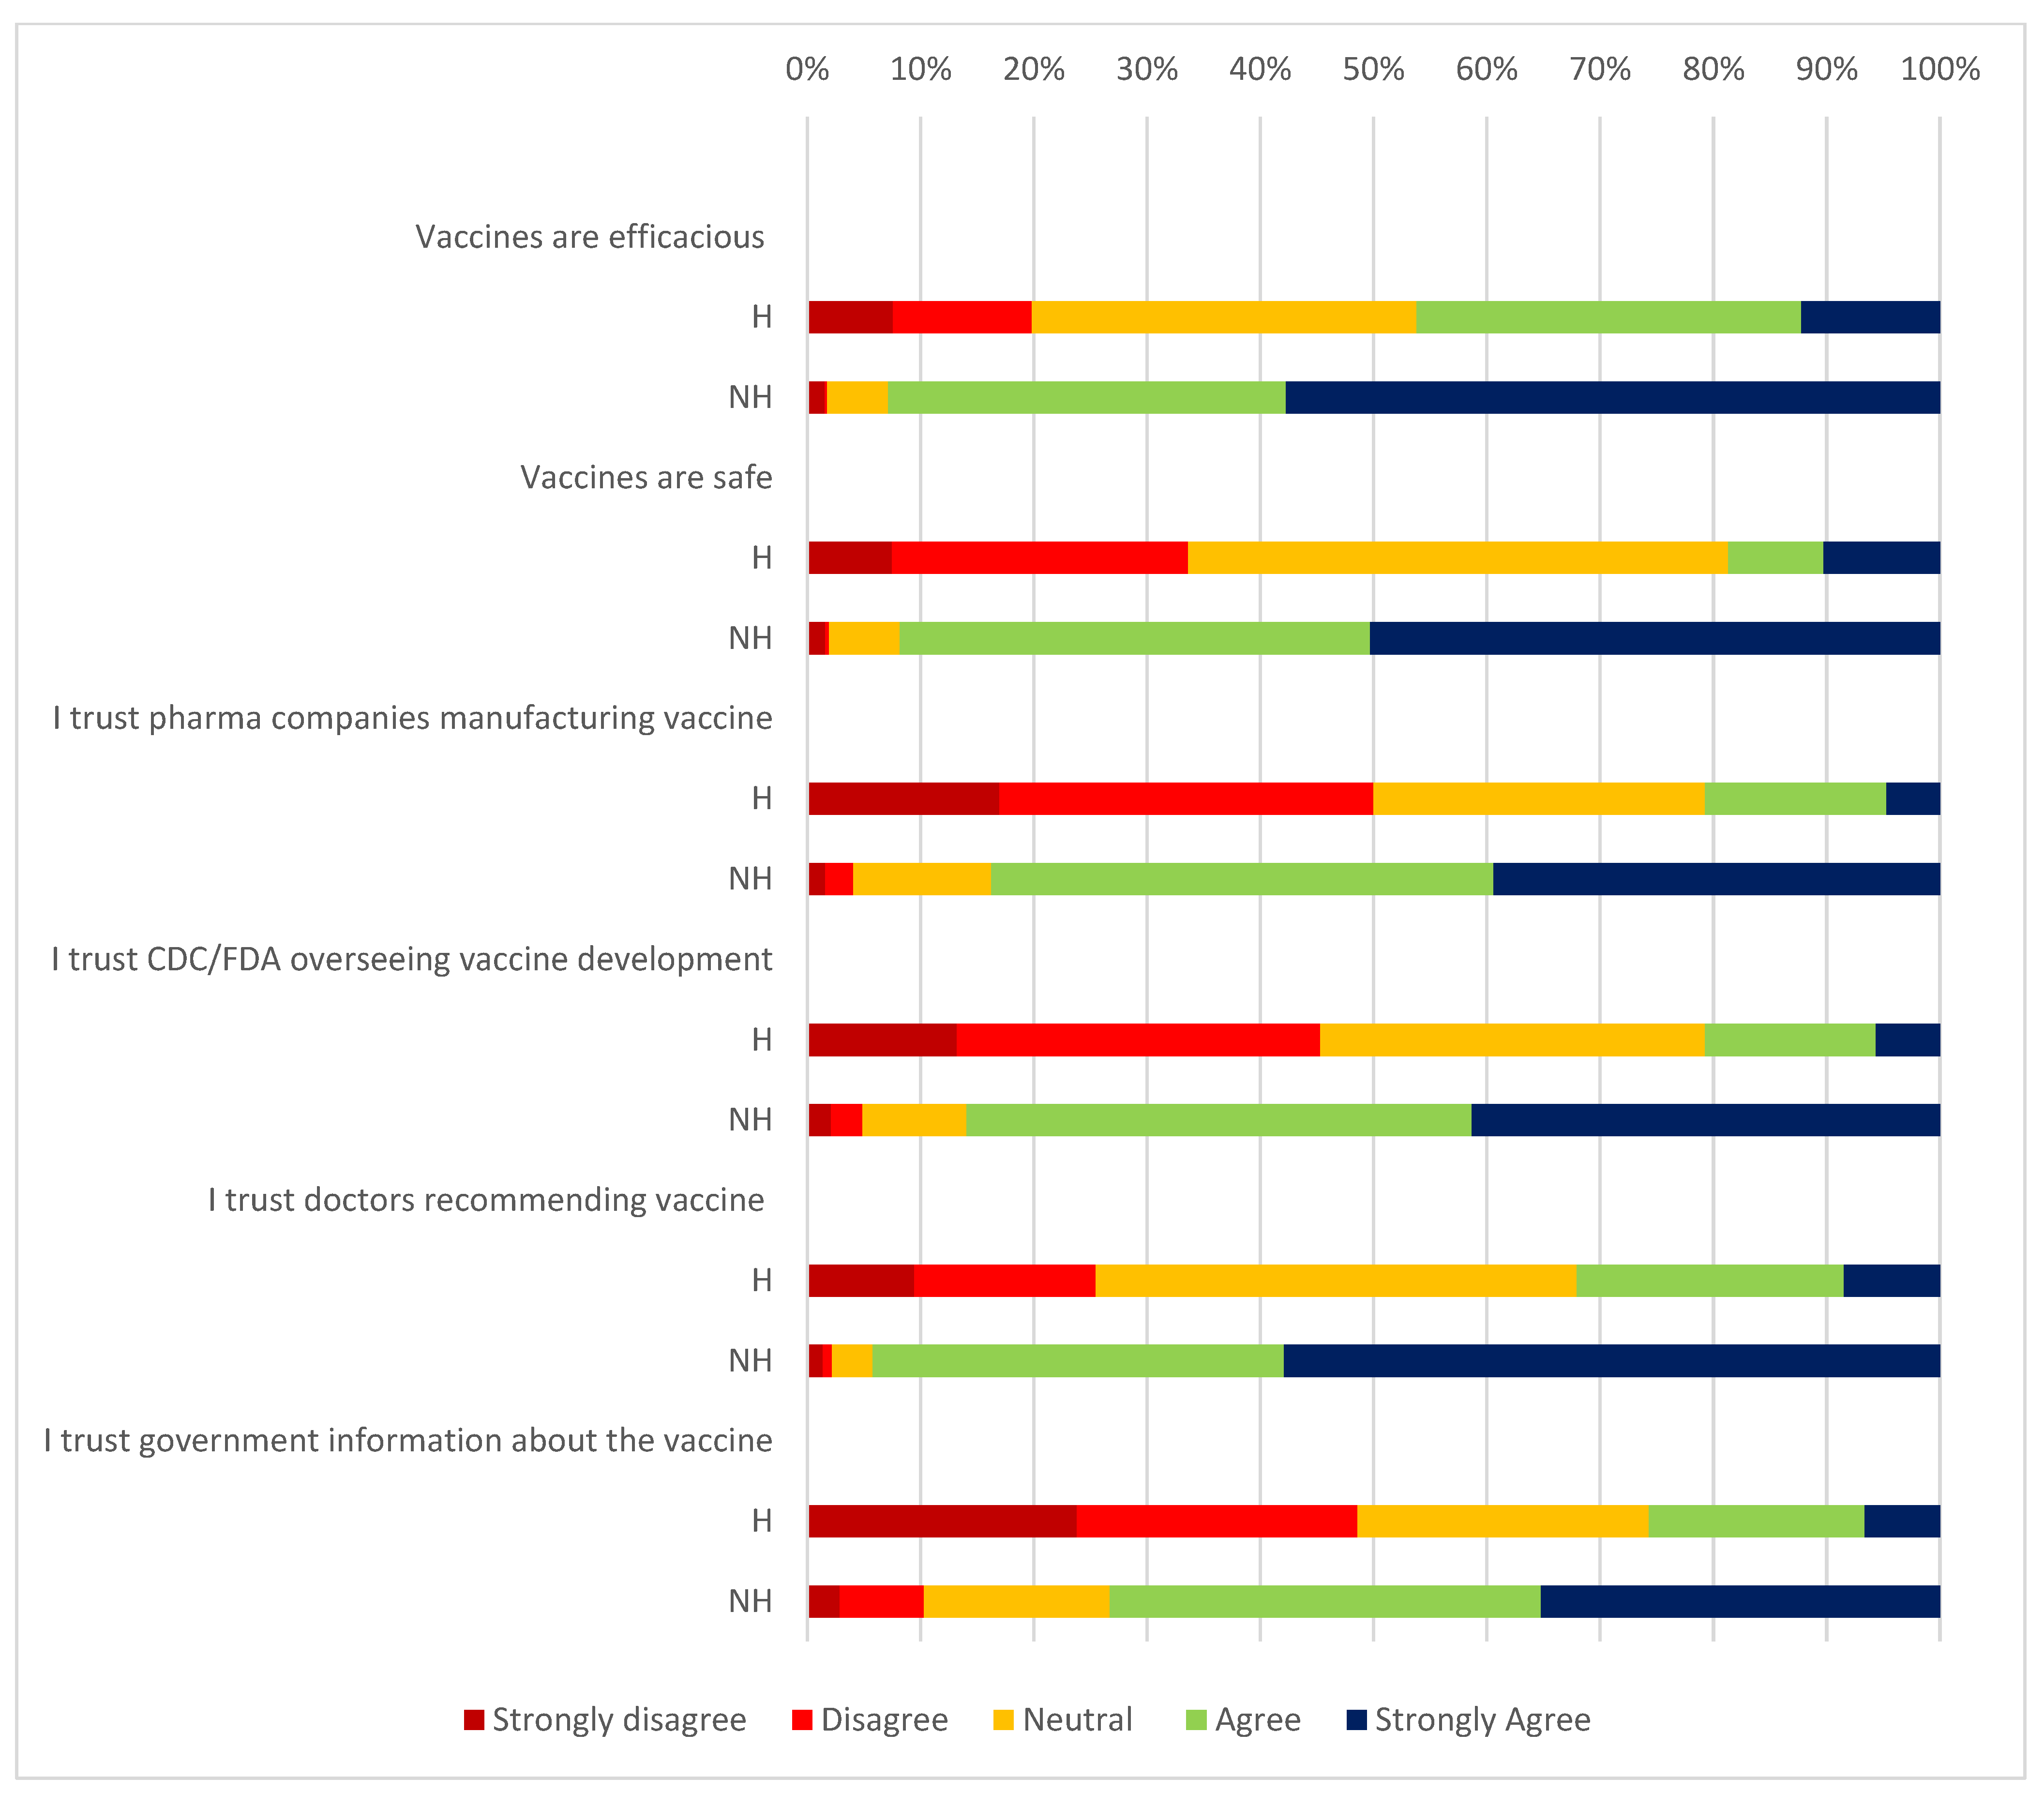
The study is quantitative, which is clear from the act of measuring correlates with vaccine hesitancy and tool selection. Specifically, to capture results summarized in Figure 1, Pal et al. (2021) use a cross-sectional survey with close-ended Likert questions, which is quantitative in nature.
Figure 1 depicts a stacked bar graph, which is evident from external characteristics, including the segmentation of bars performed using color and the utilization of comparisons between the NH and H subgroups.
The data do not reveal class size/width information, and the total frequency for each condition/question equals 100%. For all questions acting as response variables, five frequencies for the non-hesitant and five for the hesitant group are present. In terms of consistency, the non-hesitant group shows more agreement with vaccine-related statements, with the agreeing population ranging from 73% to 95% of the group and the disagreeing portion not exceeding 10%. The hesitant group’s situation reveals the opposite trends in a consistent manner. For the non-hesitant group, distributions are skewed right, whereas the hesitant group has more symmetric distributions.
Data in Figure 1 confirms that vaccine hesitancy is inversely related to trust in the healthcare system and positive perceptions of vaccines.
Conclusion
The same data might have been displayed with the help of pie charts and simple numeric tables. The advantages of pie charts include simplicity and being visually appealing, whereas the disadvantages are inefficient space utilization and the viewer’s inability to summarize data from twelve graphs. Tables’ advantages incorporate the opportunity to depict specific percentages for each question, but the disadvantages, such as the lack of clarity and demonstrativeness, are also prominent. The alternatives were not used due to their inconvenience and decreased concision compared to stacked bar graphs.
Reference
Pal, S., Shekhar, R., Kottewar, S., Upadhyay, S., Singh, M., Pathak, D., Kapuria, D., Berrett, E., & Sheikh, A. B. (2021). COVID-19 vaccine hesitancy and attitude toward booster doses among US healthcare workers. Vaccines, 9(11), 1-11.