Purpose
The present paper aims to test several hypotheses using Pearson’s correlation analysis, simple linear regression, and multiple linear regression. All the hypotheses were tested using the Sun Coast Data Set, which included several sets of data for testing different types of hypotheses associated with employees’ health and safety issues at Sun Coast Hospital. The paper utilizes Microsoft Excel ToolPak for data analysis.
Correlation: Hypothesis Testing
Ho1: There is no statistically significant relationship between particulate matter in microns and the number of sick days per employee in Sun Coast.
Ha1: There is a statistically significant relationship between particulate matter in microns and the number of sick days per employee in Sun Coast.
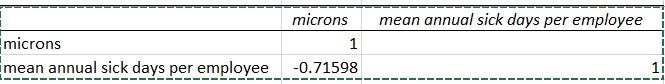
The Pearson correlation coefficient of r = -0.71598 indicates a strong negative correlation (Taylor, 1990). This equates to an R2 of.0.51, explaining 51% of the variance between the variables.
Using an alpha of.05, the results indicate a p value of.000 <.05. Therefore, the null hypothesis is rejected, and the alternative hypothesis is accepted that there is a statistically significant relationship between particulate matter in microns and the number of sick days per employee in Sun Coast.
Simple Regression: Hypothesis Testing
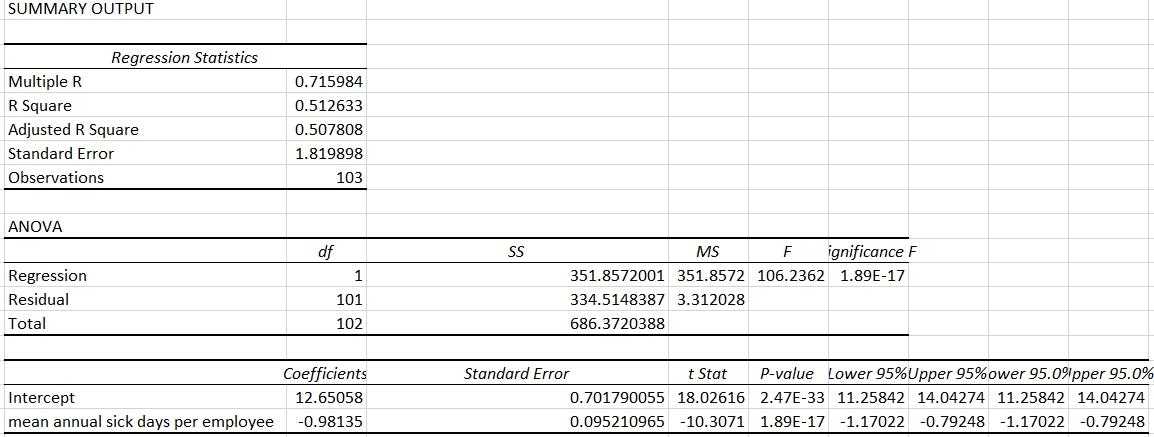
Ho2: Safety training expenditure has no statistically significant impact on lost time hours.
Ha2: Safety training expenditure has a statistically significant impact on lost time hours.
The multiple R of 0.94, which corresponds to Pearson r, indicates that there is a strong correlation between the two variables. This equates to an R2 coefficient of 0.882, signifying that safety training expenditure can explain 88% of changes in lost time hours. With the alpha level of 0.05, the ANOVA F-value of 1664.21 is statistically significant (p<0.001), which implies that the created model has a greater predictive ability than the intercept-only model. This means that the null hypothesis should be rejected and the alternative hypothesis should be accepted (McClaive et al., 2018).
The coefficient of -0.143 for safety training expenditure demonstrates that there is a negative relationship between the two variables. Since the p-value of the coefficient (p < 0.001) is below the alpha level of 0.05, safety training expenditure is a statistically significant predictor of lost time hours. The regression model is provided below.

The model demonstrates that with each additional dollar spent on safety training, lost time hours decreases by 0.143 hours.
Multiple Regression: Hypothesis Testing
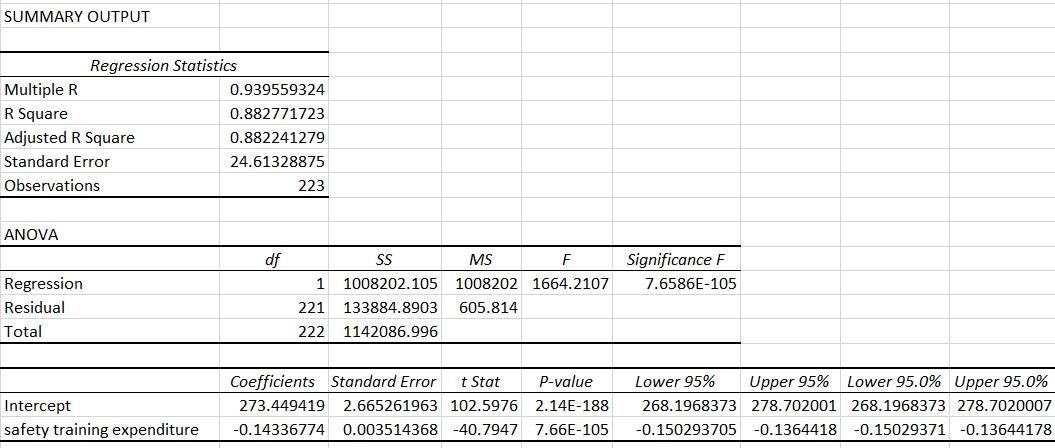
Ho3: Frequency, angle, chord length, velocity, and displacement have no statistically significant impact on sound intensity measure in decibels.
Ha3: Frequency, angle, chord length, velocity, and displacement have a statistically significant impact on sound intensity measured in decibel.
The multiple R of 0.6 indicates that there is a moderately strong correlation between the variables. This equates to an R2 coefficient of 0.36, signifying that five independent variables can explain 36% of changes in sound intensity in decibels. With the alpha level of 0.05, the ANOVA F-value of 170 is statistically significant (p<0.001), which implies that the created model has a greater predictive ability than the intercept-only model. This means that the null hypothesis should be rejected and the alternative hypothesis should be accepted (McClaive et al., 2018).
The coefficient of -0.0011 for frequency in Hz demonstrates that there is a negative relationship between sound frequency and sound intensity. Since the p-value of the coefficient (p < 0.001) is below the alpha level of 0.05, frequency is a statistically significant predictor of sound intensity.
The coefficient of 0.0473 for the angle in degrees demonstrates that there is a positive correlation between the angle and the dependent variable. However, it is statistically insignificant, as the p-value (0.205) is below the alpha level of 0.05.
The coefficient of -5.4953 for chord length demonstrates that there is a negative correlation between this independent variable and the dependent variable. However, it is statistically insignificant, as the p-value (0.061) is below the alpha level of 0.05.
The coefficient of 0.0832 for velocity in meters per second demonstrates that there is a positive correlation between this independent variable and the dependent variable. Since the p-value of the coefficient (p < 0.001) is below the alpha level of 0.05, velocity is a statistically significant predictor of sound intensity.
The coefficient of -240.506 for displacement demonstrates that there is a negative correlation between this independent variable and the dependent variable. Since the p-value of the coefficient (p < 0.001) is below the alpha level of 0.05, displacement is a statistically significant predictor of sound intensity.
The regression model is provided below:

The model signifies that with an increase of 1 Hz in frequency, sound intensity decreases by 0.0011 dB; with an increase in angle by one degree, sound intensity increases by 0.047 dB; with an increase in chord length by one, sound intensity decreases by 5.5 dB; an increase in velocity by 1 meter per second increases sound intensity by 0.083; and with an increase in displacement by one, sound intensity decreases by 240.51 dB.
References
McClaive, J., Benson, G., & Sincich, D. (2018). Statistics for business and economics. Pearson.
Taylor, R. (1990). Interpretation of the correlation coefficient: a basic review. Journal of diagnostic medical sonography, 6(1), 35-39.