Description of mobile users
Descriptive statistics are useful in summarizing data (Levine, Krehbiel and Berenson, 2010). Some of the most common types of descriptive statistics include meaning, mode and median (Francis, 2004). Mean refers to the average of a data sample while the mode is the most frequent observation in a sample. On the other hand, the median is the central value in a sample above and below which, half of the total population lies.
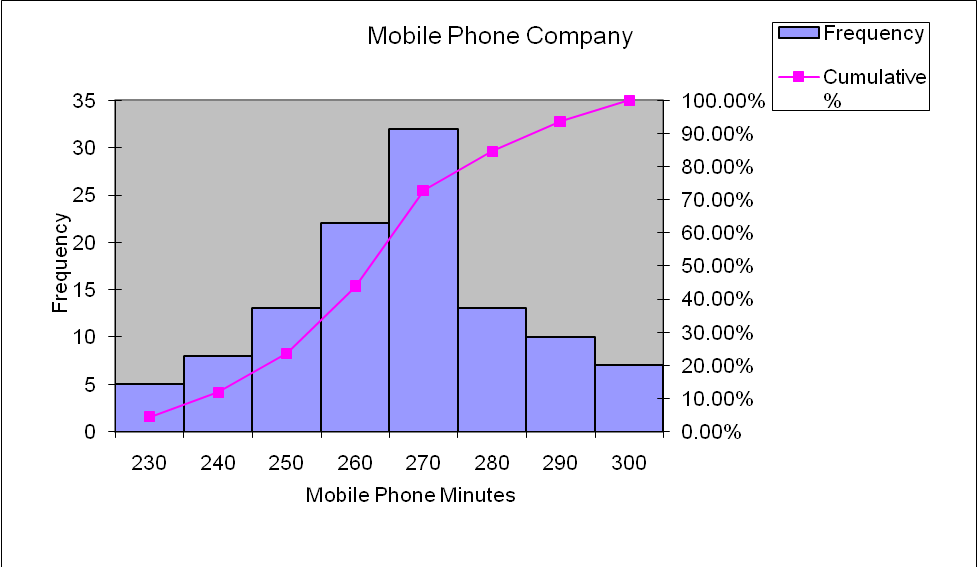
On average, the company’s mobile phone subscribers’ call rate for the month of April was 261 minutes. Therefore, the Average Revenue per User (AVRPU) was for a call rate of 261 minutes.
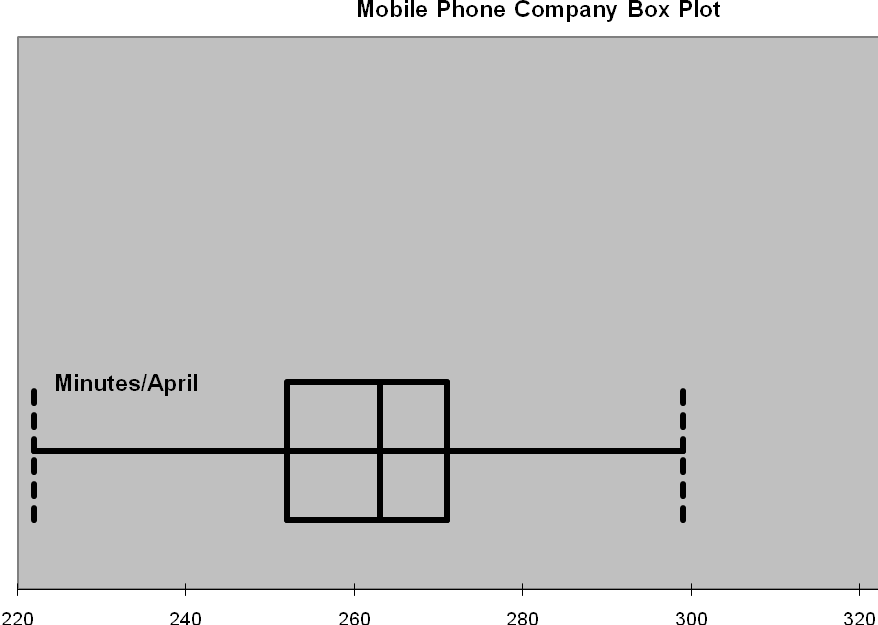
A majority of the subscribers had call rates that were below 252 minutes with a mean usage of 261 minutes. There were a few callers whose call times were higher than the mean, the highest usage being 299 minutes and the lowest monthly call time being 222 minutes.
Half of the total subscribers had a monthly call time of below 263 minutes and thus more than a half of subscribers had call rates were that above the mean call rate of 261 minutes.
According to the five-number summary below, 25 percent of the total callers had a monthly call time of 252 minutes and below whereas, 75 percent had a rate of 271 minutes and below. The top 25 percent of the callers had call rates of between 271 and 299 minutes. It is therefore worth noting that most callers had rates that were close to the mean rate. The table below provides a summary of this data.
The frequency distribution below presents the phone usage for the company’s subscribers in the month of April. The box plot which follows provides a summary of the mobile usage distribution.
Dispersion of mobile usage
According to Francis (2004, p. 129), measures of dispersion are useful in explaining the spread of a population or sample. This can be done through the use of range, variance, and standard deviation. Range measures the difference between the largest and smallest value in a sample. In the case of this data, the difference between the subscriber who had the lowest call time and the one with the highest was 77 minutes.
Mobile usage varied significantly as noted from the range computed above. In addition, the variance of the sample was high (306.68 minutes) as well as the standard deviation (17.51 minutes). On average, the subscribers’ call rates varied from the average call rates by 17.5 minutes signifying the difference in calling habits for the company’s subscribers.
The total population portrayed characteristics similar to those of the sample since the standard error is small (1.67). Therefore valid conclusions regarding the population can be made using the sample. Statistics regarding the distribution of mobile users are summarized in the table below.
Distribution of mobile usage
Distribution of data can be determined through the use of skewness and kurtosis analysis. Skewness evaluates whether data is symmetrical or not while kurtosis measures whether data is peaked (Black 2009, p.78). Subscribers’ mobile usage was normally distributed since the skewness of the data was nearly zero (0.001613091). However, the distribution was generally flat as noted from the kurtosis which was low (-0.338) as compared to a kurtosis of a normal distribution which should be 3.
Based on the measures of distribution above, it is evident that there were a number of subscribers with monthly call times below and above the mean. At a confidence level of 95 percent, mobile usage was between 257.79 minutes and 264.34 minutes. Therefore, the company serves customers in different market segments. These statistics are summarized in the table below.
Use of the report to the company
This report provides an analysis of mobile usage which can be of critical benefit to the company. For instance, the data can form a starting point in defining the company’s target market since it is evident that subscribers have different spending habits. As such, it is important to develop market strategies that are responsive to the needs of each market. Efforts to increases customer groups with high call rates should be heightened while those with low call times should be encouraged to increase their call times through promotions. The report could also be used in allocating marketing budgets and in the determination of the quality of service to accord to each market segment.
Finally, the company could use the data to make pricing decisions. As evidenced from the data analyzed above, most of the subscribers had call rates below 271 minutes. The subscribers can be provided with incentives such as discounted prices, in a bid to attract increased spending. In addition, callers could be offered loyalty points depending on their usage thereby providing an incentive for high call times.
List of References
Black K. 2009. Business statistics: contemporary decision making. John Wiley and Sons publishers
Francis A. 2004. Business Mathematics and Statistics. Andover: Cengage Learning EMEA
Levine DM, Krehbiel TC and Berenson ML. 2010. Business Statistics: First Course, 4th Edition. New Jersey: Prentice-Hall