This academic work is a laboratory report summarizing the results of a practical simulation of the epidemiological dynamics of a simulated population. Thus, the report’s central tasks are to summarize the data obtained, answer the questions posed, and analyze the results critically.
Results
This lab report’s main results were obtained using the Lab Disease online simulation tool to quantitatively predict the incidence dynamics in the simulated population for a selected infectious disease. KOLD disease was investigated for samples of three sizes to determine the pattern of respiratory disease prevalence in patients as a function of regional population density. The simulation data are shown in the two parts of Table 1. It is noteworthy that each simulation run yielded unequal results because it is difficult to expect identity in the case of clinical trials. The spread of a contagious disease is individual and depends on many factors, including sample size and homogeneity, innate genetic resistance, and vaccination.
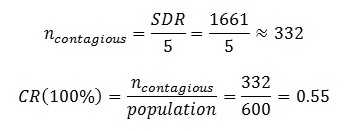
As can be seen, as the sample population increased in size, the incidence of the disease naturally increased. The number of infected people was calculated as the total number of sick days divided by the average duration of illness (equation [1]), and the infection rate as the proportion of infected people from the total number of vulnerable group (equation [2]). Thus, the CR infection rate’s dependence on the population size is practically linear, as shown in Figure 1. Consequently, for too low a density, the need for strict clinical restrictions is less than for high densities, where quarantine and universal vaccination are required. For low densities, these steps are selective vaccination, control, and tracking of individual cases.
Table 1: Disease Simulation
The second important result in this laboratory report was to find a relationship between the vaccinated population and the total number of infections and deaths. The working hypothesis was that a large number of vaccinated individuals in the sample leads to an expectedly low mortality outcome (Disease in Vaccinated Populations). Table 2 summarizes the simulation data for Impfluenza, the average duration of which was equated to three days according to the tool settings.
Table 2: Vaccine Simulation
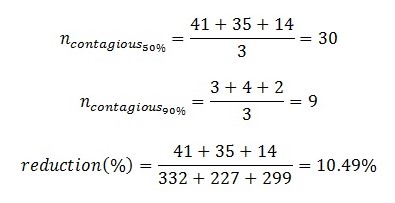
As shown in Table 2, as the proportion of vaccinated people increased to 90%, a significant reduction in the infections and deaths cases in the simulated sample was observed. Thus, the average number of infections for the first scenario was 30 (equation [3]), whereas when the proportion increased to 90%, this parameter was numerically equal to three ([4]). In a comparative analysis, the vaccine for the medium density sample reduced the number of infections by 90% ([5]). It was also measured that when the 75% vaccinated mark was reached, the CR per capita did not exceed 0.1.
Conclusion
In conclusion, it should be noted that the study of epidemiological situations is a statistical task aimed at the numerical analysis of individual scenarios. The report showed that the higher the population density, the higher the infection rate among people due to residence proximity and the frequency of social contacts. It was also demonstrated that increasing the proportion of people who are vaccinated significantly reduces infection rates. This laboratory work is a useful material for studying the theory of epidemiology and predicting COVID-19 scenarios. Since this viral disease is highly contagious, reducing social contact, distancing, and universal vaccination should be an effective weapon to suppress the pandemic.
Works Cited
“Disease in Vaccinated Populations.” University of Oxford, 2020, Web.
Lab Disease. The Habitable Planet, n.d., 2021. Web.