The field of nursing and medicine constitutes one of the areas that benefit a lot from research and statistics. It is no doubt that statistics has played a big role in helping those in the medical sector to successfully come up with better strategies, medication as well as and interventions to enhance the well-being of human beings. Indeed, there are numerous statistical techniques that are applied. It is the purpose of this paper to critically look at how correlation analysis is applied. This will be accomplished by practically applying the technique in a set of data in an SPSS environment. Correlation analysis is usually used when exploring the relationship between two numerical variables (Kothari, 2004). Additionally, it aids in establishing if there is a straight-line relationship between the variables, the strength of the association as well as the direction of the relationship. There are two types of correlation; Pearson’s correlation which is applied when the variables are normally distributed, and numerical. On the other hand, Spearman’s is used when one or both of the variables are on ordinal scales or at least one numerical variable is not normally distributed. The correlation coefficient range between -1 and +1. This shows a perfect correlation, and values close to 0 indicate a weak correlation (Cohen et al., 2002).
In this section, a correlation matrix between the following variables; the number of visits to the doctor in the past 12 months (docvisit), body mass index (bmi), physical health component subscale (sf12phys), and mental health component subscale (sf12ment) is generated. Additionally, the writer will conduct descriptive statistics for each of the aforementioned variables.
From the analysis, it is evident that the strongest correlation was between the number of doctor visits in the past 12 months and the physical health component score standardized at -3.16. This means that a decrease in the number of times one visits a doctor in a year leads to a decrease in physical health component score standardized. The weakest correlation was between mental health component score standardized and body mass index standing at -0.078.
The value one on the diagonal of the matrix indicates a perfect positive relationship between the variable and itself. There are six original correlations, highlighted in yellow in Table 1. The relationship between body mass index and physical health component subscale is weak and negative, standing at -0.134.
Physical Health Component Score was the variable most strongly correlated with body mass index at -0.134 with a sample size of 866.
From table 2, the mean and standard deviation for BMI are 29.22 and 7.38 in that order meaning that the average BMI is approximately 29 while most range between 22 and 36. On the other hand, the mean and standard deviation for doctor visits are 6.80 and 12.720, respectively.
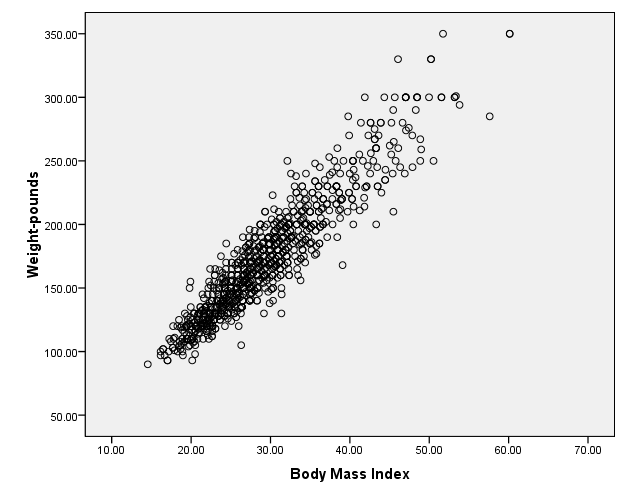
In order to understand whether a relationship between two variables is linear, there is a need to use graphical representation (Brookmeyer & Donna, 2004). In this part, a scatter plot of BMI and weight in pounds will be generated. From fig. 1, it is evident that the relationship is linear. It can also be deduced that the relationship is strong and positive. From a quick glance, a researcher can easily understand the strong linear relationship between the two variables. From table 3, the mean and standard deviation for BMI are 29.22 and 7.38, respectively, while weight had a mean of 171.46 pounds and a standard deviation of 45.44 pounds.
References
Brookmeyer, R. & Donna, F. S. (2004). Monitoring the health of populations. Oxford University, New York.
Cohen, J., Cohen P., West, S. & Aiken, L. (2002). Applied multiple regression/correlation analysis for the behavioural sciences. New York: Psychology Press.
Kothari, C. (2004). Research methodology: Methods and techniques. New Delhi: New Age International.