Introduction
Assessing the economic performance of individual states through credible data is a way to obtain objective information about development-related characteristics. Based on the extraction of current data from valid sources, such parameters as per capita GDP, population size, economic freedom, and some other indicators will be considered. Country-specific examples, compiled in a convenient format, can allow a visual assessment of the corresponding differences and their reasons.
GDP in Different Countries
Table 1. The per capita GDP (The World Bank, 2023).
List of Countries from Highest to Lowest Per Capita GDP
Based on the results demonstrated in Table 1, it is possible to calculate per capita GDP using 12 different countries and utilizing such variables as GDP and total population. The assessment of all indicators can help identify the characteristic features of the development of these states and analyze how the corresponding characteristics are expressed in the overall level of economic development. When distributing the aforementioned nations classified based on the per capita GDP criterion in descending order, the following list can be proposed:
- Norway – $106,139.47.
- Switzerland – $92,125.47.
- Netherlands – $55,964.47.
- Greece – $20,741.47.
- Panama – $17,354.47.
- China – $12,719.84.
- Malaysia – $11,972.47.
- Mexico – $11,086.47.
- Saudi Arabia – $30,425.47.
- United States – $76,457.47.
- Brazil – $8,926.47.
- Vietnam – $4,163.47.
This ranking provides valuable insights into the relative economic development of the states listed. It highlights the higher average income and living standards in such countries as the Netherlands, Norway, and Switzerland, indicating their advanced economic development. In addition, it also showcases the challenges faced by states with lower per capita GDP, particularly Brazil and Vietnam, which suggests that these nations are in dire need of economic development.
Comparison of Order for Total GDP and Per Capita GDP
The order of countries based on total GDP may not necessarily correspond to the order related to per capita GDP. For instance, given the data demonstrated, the United States shows the highest total GDP; nonetheless, it ranks from the standpoint of per capita GDP. This discrepancy occurs because total GDP is affected by both the economic size and the population, while per capita GDP focuses solely on the average income per person. The difference between total GDP and per capita GDP may be associated with variations in population sizes among countries.
States with larger parameters, such as China and the United States, have higher total GDPs due to their economies’ sheer sizes. Nonetheless, this does not necessarily concern higher per capita GDP if the population is also big. Smaller countries with smaller populations, such as Norway and Switzerland, can have higher per capita GDP, although their total GDP parameters are lower.
Analysis and Discussion of the Data Significance
The data on per capita GDP provides helpful information on how the average income and living standards within each country depend on the corresponding figures. States with higher per capita GDP most frequently demonstrate higher levels of economic prosperity. These countries can frequently offer better infrastructure, healthcare systems, and educational possibilities for local people. States with lower per capita GDP, in turn, may face obstacles to providing adequate resources and social opportunities.
Additionally, the data highlights the value of reviewing population size when comparing distinctive economies. Total GDP alone does not provide a comprehensive analysis of a country’s economic well-being. By evaluating per capita GDP, policymakers and economists have better chances to comprehend income distribution, inequality, and the overall economic conditions experienced by individuals within a state.
Reflection on Learning from the Assignment
This assignment has provided essential insights into the concept of per capita GDP and its significance in understanding economic development. It has highlighted the significance of considering population size when comparing and contrasting distinctive economies. Additionally, the exercise has reinforced my understanding that total GDP by itself does not represent the typical income level or living standards of a state’s population. Overall, this assignment has deepened my awareness of economic indicators and their effects. It has emphasized the need for a thorough analysis that considers various factors, such as population size, when assessing economic performance and well-being.
Index of Economic Freedom
Table 2. Rank and Overall Score of Economic Freedom (The Heritage Foundation, 2023a).
Table 3. Scores in Business, Trade, Financial Freedom, and Property Rights (The Heritage Foundation, 2023b).
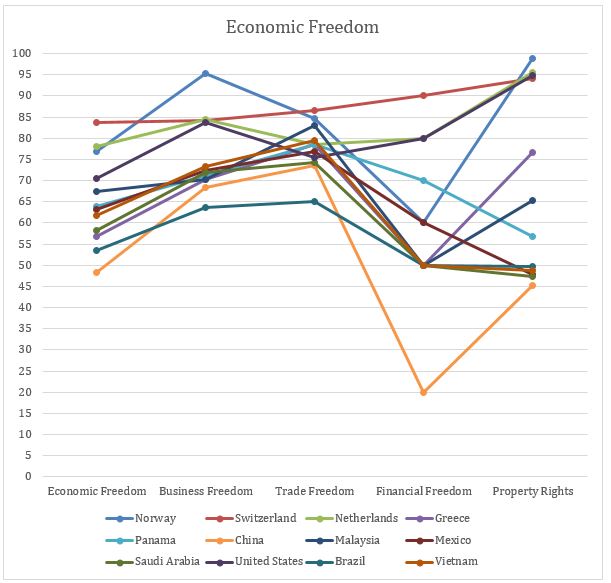
In Figure 1 below, the rank in economic freedom (overall) and other indicators are compared with the order of the countries in accordance with the per capita GDP parameter determined in Part 1:
Analysis of Results
The data on economic freedom rankings, as provided by The Heritage Foundation (2013b), assesses the level of economic openness, business freedom, trade freedom, financial freedom, and property rights protection in each country. In Table 2 and Table 3, some essential figures are given to evaluate the specific characteristics of economic freedom. These factors are crucial for attracting investments, fostering innovation, and creating a conducive business environment. Conversely, lower rankings suggest that countries may have insufficiently developed economies, with potential barriers to economic growth and limited opportunities for businesses and individuals.
The Significance of the Data and the Relevance of Rankings
The rankings of economic freedom and per capita GDP are relevant as they help compare the states’ specific parameters and provide a background for realizing the economic conditions and development of each nation. They may assist various stakeholders, including economists, policymakers, and foreign investors, in analyzing the attractiveness of a country, as well as identify areas for improvement in financial policies and specific institutions.
The comparison between economic freedom rankings and per capita GDP rankings may also provide intriguing insights. For instance, such states as Switzerland and the Netherlands have the highest positions in both parameters, which demonstrates a strong correlation between economic freedom and prosperity. Conversely, China and Saudi Arabia rank lowest in economic freedom but have higher rankings in per capita GDP. This confirms that other factors, such as government intervention or resource wealth, may critically affect their economic productivity.
The analysis of economic freedom rankings and per capita GDP rankings allows for a comprehensive assessment of all the reviewed states’ economic development. Economic freedom plays a crucial role in promoting entrepreneurship, innovation, and investment, which are essential for sustained economic growth. On the other hand, per capita GDP reflects the average income and standard of living, providing insights into the well-being of the population.
By comparing rankings, various interested parties can identify areas for improvement and formulate strategies to enhance economic conditions. Rankings serve as a valuable tool for benchmarking and realizing the relative performance of countries, facilitating informed decision-making and policy revision.
Reflection on Learning from the Assignment
Overall, this assignment has deepened my understanding of economic indicators and their implications. It has reinforced the significance of considering multiple factors and parameters when reviewing economic development and has provided a broader perspective on the complexities of global economies.
Conclusion
The GDP rankings of different countries highlight variations in economic development and prosperity. Such states Brazil and China have high GDP figures, while Greece and Malaysia also show significant economic output. The index of economic freedom rankings assesses the corresponding factors, including economic liberty, trade openness, financial independence, and safeguarding of property rights. Higher rankings indicate a more favorable environment for economic growth and development, while lower rankings suggest areas for improvement in economic policies and institutions.
References
The Heritage Foundation. (2023a). Country rankings. Web.
The Heritage Foundation. (2023b). Explore the data. Web.
The World Bank. (2023). World development indicators. Web.