Executive Summary
The study described below is a managerial report on implementing automated warehouse systems at R.C. Coleman’s company. The executive report outlines the project’s activity schedule and anticipated completion date for the warehouse expansion. The report also produces a network diagram that displays a significant path and, consequently, the project’s crucial activity. The report incorporates all project scheduling, planning, and control methods to adequately respond to the assignment’s questions.
Introduction
The project manager must consider additional metrics, such as accomplishing the established strategic objectives and customer satisfaction. Delivering an unsatisfactory project to the project sponsors and customers is caused by an imbalance between the important performance metrics and the anticipated organizational benefits from the project (Badewi, 2018). If a project’s value satisfies its clients’ needs, it is successful.
The project’s output should be in line with the strategic objectives of the company and should also offer a positive return on investment. The rising awareness of the quality mandate and strategic importance of time-based competition for continuous improvement has forced organizations to introduce new products or service life cycles to increase operational efficiency (Badewi, 2018). Project managers can implement adequate project scheduling and control to prevent unneeded delays and expense overruns.
This managerial report focuses on R.C. Coleman and his role as project manager in charge of installing an automated warehousing system at his company. Appropriate project management procedures, such as planning, scheduling, and controlling, ought to be implemented for each of the project’s most important phases. In addition, the report responds to many case study-related questions required to complete the managerial report.
R.C Coleman Project Management
Phases of project management include planning, during which the project scope, objectives, and team are established and defined. The project manager, who is in charge of the entire project, is responsible for delegating responsibilities to the team working on the project and is obligated to report on the team’s performance. The project manager oversees the project and is responsible for coordinating its operations with those of other organizational departments and is empowered to provide regular reports to the top management (Meirelles, Tereso, & Santos, 2019). One of the project manager’s primary responsibilities is making sure that everything gets done in the right order and on schedule. The project must also be completed within the allotted budget and time and achieve the quality standards established at the outset.
Furthermore, it is the project manager’s responsibility to ensure that team members have access to all the resources they need and the direction and inspiration they need to carry out their responsibilities successfully. Hence, project managers need to have strong interpersonal and communication skills and adhere to the anticipated ethical standards in the implementation of projects free from conflicts of interest (Badewi, 2018). To successfully manage the project and improve the efficiency of the scheduling process, they should also use a work breakdown structure during the planning phase.
Project managers use scheduling to determine the order of tasks and the amount of time they should take. During this stage, project managers have the leeway to assign the necessary resources to each activity and determine an accurate timeline for its completion (Meirelles et al., 2019). At this stage, they employ various methods for scheduling the project, the most successful of which is the usage of Gantt charts. Project managers can use Gantt charts to guarantee comprehensive preparation for all tasks, accurate estimation of the total time required for the project, improved documentation, and accurate recording of all task durations.
Scheduling projects can also be done with tools like the critical path method (CPM) and the project assessment and review technique (PERT). All of these methods aid the project in determining the priority linkages between activities and gathering extensive information on the current relationships between specific tasks and others and the overall project. Similarly, they ensure the time and money spent on the activities are reasonably estimated (Badewi, 2018). In addition, by pinpointing the project’s most pressing bottlenecks, the scheduling methods aid in making the most of the project’s available resources, whether money, time, or people.
During the project control phase of project management, finances, resources, and output quality are all kept under tight scrutiny. At this point, the project manager should have established a feedback loop and applied best practices for reworking the entire project plan and reallocating resources where they are needed most. To keep tabs on everything going on, project managers use tools like PERT charts and reports and the computerized critical path technique (Meirelles et al., 2019).
Documentation such as labor requirement reports, detailed cost breakdown reports, variance reports, work status reports, time analysis reports, expenditure forecast and raw material reports, and hour and cost summaries reports are all vital at this stage of the project and can only be provided by the best practices and techniques used by the project managers (Meirelles et al., 2019). When it comes to project management, the stakes are at their highest during the planning, scheduling, and controlling phases. To minimize setbacks and extra expenses, project managers have the right to employ tried and true methods of project management. It is a model of both waterfall and agile project management in action.
Network Diagram
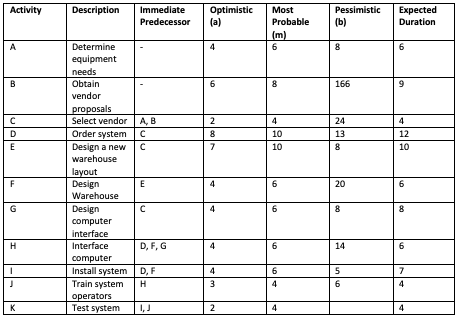
The project manager, R.C. Coleman, compiled the following table to outline the steps to be taken to put the automated warehouse system into place. The table gives specific week-by-week time activities in terms of the most likely, optimistic, and pessimistic activity.
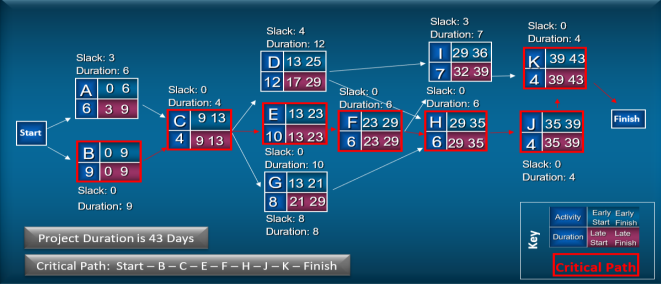
The project network for R.C. Coleman is displayed below based on the aforementioned data. The relationship between the project activities and their order are depicted in the project network.
We create the project schedule and then create a table that displays activity times used for events such as early start, early finish, late start, late finish, and event slack. Here, the goal is to determine the anticipated start and end dates for each project activity. The R. C. Coleman project is scheduled to take 40 weeks to complete all of its tasks. The project’s estimated completion time can be fewer than 40 weeks because multiple tasks can be completed at once.
The expected time for each activity can be calculated as follows;
t = (a + 4m +b) / 6
Where a = optimistic time;
- b = pessimistic time;
- m = most probable time
Therefore, the expected completion times for activities are given in Table 1 above.
Critical Path Analysis
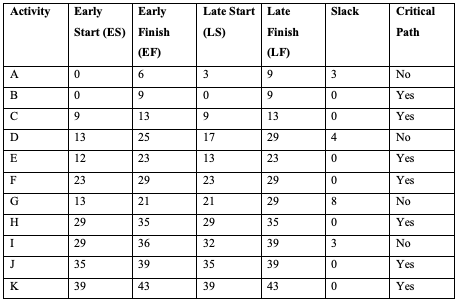
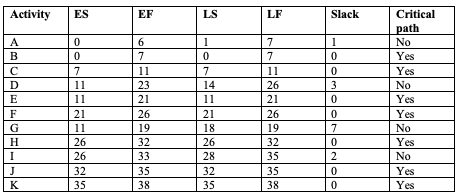
The Forward Pass and Reverse Pass methods are used to determine the Earliest Start (ES), Earliest Finish (EF), Late Start (LS), and Late Finish for the network in Table 1 to complete the Critical Path Analysis (LF). After establishing the earliest and latest times for each activity, slack time is calculated. It represents the amount of time that can be spent on an activity without slowing down the project’s advancement. The formulas Slack = LS – ES or Slack = LF – EF are used to determine the slack time. On the critical route, the tasks that have a Slack Time of 0 are referred to as critical tasks.
Using the anticipated time t, previously estimated; ES, EF, LS, and LF; we identify the essential activities in the network diagram in order to identify the critical path. The critical path of the project is identified as B-C-E-F-H-J-K. This implies that any delay in finishing one of these tasks will cause the project’s completion date to slip.
Activity time utilization, including early start, early finish, late start, late finish, and event slack, is displayed in the table below.
Project Duration
The expected projection completion time is equal to the scheduled time for critical activities.
Therefore; t = t (B) + t (C) + t (E) + t (F) + t (H) + t (J) + t (K) = 9 + 4 + 10 + 6 + 6 + 4 + 4 = 43 weeks.
The project, however, is not completed within the desired 40 weeks as it has been shown to take 43 weeks.
The Probability of Project Completion in the Desired 40 weeks
The calculated duration of 43 weeks is higher than the 40-week desired completion time and cannot be attained if the project proceeds as planned. The probability of the project being completed on time can be determined with the help of the Standard Normal Equation. This can be done using the variance and standard deviation for each activity in Table 1. The variance and standard deviation of a project can be calculated using the PERT method by adding the variances of all critical path activities together.
The probability is given by
Z = (T – TE) / Ó c
First, we calculate variance using the formula;
σ2 = [(b-a) / 6]
Where a= optimistic time and b = pessimistic time
Variance for A to K are calculated from the above formula.
Table 3: Calculation of Variances.
Because the total variance is equal to the variance in the 43-week project timeline, this means that;
σ 2 = 5.6665;
and the standard deviation σ= √5.6665= 2.3804
The Z-value for T=40 weeks and E(T)=43 weeks, the projected time of completion, is then calculated as follows:
Z = (T – TE) / Ó c
= -1.2609
Shortening of Project Completion Time for 80% Change
The Excel formula NORMDIST was used. Based on these calculations, the conclusion can be made that the probability of project completion within 40 weeks is 10.38%, which is low. Project Crashing is the practice of cutting down on the amount of time spent on each activity in a network in order to shorten the duration of the critical path and, thus, the duration of the project as a whole. The number of weeks needed to complete the project should be decreased from 40 to 38 in order to ensure an 80% chance of meeting the 40-week completion period. The Excel Formula NORMSDIST uses the Normal Distribution Equation to derive the necessary Z score for an 80% chance of success.
For 80%, the value of z is +0.84; thus from the formula in the above question
0.84 = 40 – E(T) / √5.6665
= E(T) = 38 weeks
If R.C. Coleman, the project manager, wants to finish the project in 38 weeks instead of 43, he may consider crashing activities.
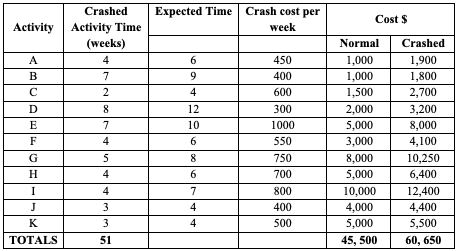
Activity Crashing Decisions and Revised Activity Schedule for the Warehouse Expansion Project
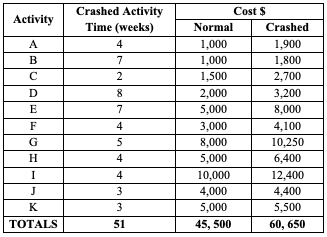
The totals can be calculated as shown in Table 4 below.
To reduce the financial burden of crashing as much as possible, we create a linear programming model.
Let Xi = the completion time for activity i and;
Yi = the amount of crash time for activity i
Therefore, the objective function is minimized as follows;
Min 45 YA + 400 YB + 600 YC + 300 YD + 1000 YE + 550 YF + 750 YG + 700 YH + 800 YI + 400 YJ + 500 YK
s.t
XA+Y A ≥ 6, for X K ≤ 38
XB+YB ≥ 9, for YA ≤ 2
XC +YC−XA ≥ 4, for YB ≤ 2
XC +YC−XB ≥ 4, for YC ≤ 2
XD+YD−XC ≥ 12, for YD ≤ 4
XE+YE−XC ≥ 10, for YE ≤ 3
XF+YF−XE ≥ 6, for YF ≤ 2
XG+YG−XC ≥ 8, for YG ≤ 3
XH+YH−XF ≥ 6, for YH ≤ 2
XH+YH−XG ≥ 6, for YI ≤ 3
XI+YI−XD ≥ 7, for YJ ≤ 1
XI+YI−XF ≥ 7, for YK ≤ 1
XJ+YJ−XH ≥ 4, All Xi Yi ≥ 0
XK+YK−XI ≥ 4
XK+YK−XJ ≥ 4
Table 6 below shows the optimal crashing decisions for all the activities.
Table 6: Optimal Crashing Decisions.
A revised activity schedule for the warehouse expansion project is also shown in table 7 below.
Conclusion
R.C. Coleman’s managerial report outlines the advantages of project managers embracing the project’s iron triangle, which consists of scope, time, and money, as well as the strategic objective of the firm and customer expectations. This case study used project management approaches to determine that R.C. needed 40 weeks to finish the project. The existing project plan will not allow Coleman’s top management to be attained. This is because the critical tasks of the project need to be completed over the course of at least 43 weeks. The probability of completing the project in 40 weeks was 10.38%, which is quite low.
In order to reduce the total duration of the project, it is recommended that project crashing methods be used. The project timeline would need to be shortened from 40 weeks to 38 weeks to ensure an 80% chance of success in meeting the target completion date. The network of the project and the activity schedule with the pessimistic, most likely, and optimistic dates served as the project’s foundation.
References
Badewi, A. (2018). The impact of project management (PM) and benefits management (BM) practices on project success: Towards developing a project benefits governance framework. International Journal of Project Management, 34(4), 761-778. Web.
Meirelles, E. G., Tereso, A., & Santos, C. (2019). The Importance of Project Management Competences: A Case Study in Public Administration. Springer International Publishing. Web.