Abstract
Multimedia has been in use for a limited period; however, it has undergone significant transformations within the lifestyle of individuals. Therefore, multimedia can be a crucial element in the education sector too. One of the ways to use multimedia in education is through the use of motion pictures.
The method allows creative learning while backing knowledge development and ease of learning. This study aims to evaluate the impact of motion graphics on learning color theory lessons against the traditional technique. The nature of the survey is experimental and practical to ensure a broad capability.
Classes A and B were chosen from the 8th graders of S. M. School, each with fifteen students. The pre-test and post-test techniques within the two control and experimental groups were utilized to ascertain the variances between the two classes. The outcomes indicated no significant variations between the means of the class A and B scores.
The theme of the visible spectrum from the lesson on color theory was imparted for both categories A and B. Schooling through the employment of the traditional method for class A and schooling with the usage of motion graphics for class B were undertaken. Then the two classes answered the questions. T-tests were employed to explore the change between the means of the two classes’ scoring, depicting the mean scores of the two courses in the post-test. The finding indicated a significant disparity between the mean scores of the two courses in the post-test.
Introduction
Teachers can employ digital footage in different ways to assist learning and teaching. Digital media can be used to enhance schooling through the provision of motion graphics, animations, digital portfolios, electronic grade books, real-time feedback, and learning games on teacher and student performance (Twyman, 2018). Motion graphics refer to digital animation or video pieces that make it appear like a thing is turning or moving. In multimedia initiatives, motion graphics are employed in conjunction with sound. Today, graphic motion has been utilized as a teaching technique to help enhance learners’ knowledge development. Majorly, the depiction of motion graphics is aided by electronic media technology. However, manual-propelled technology can alternatively be employed. This manual-powered technology includes a flip book, proximoscope, thaumatrope, stroboscope, or phenacite scope. Although the phrase “motion graphics” can be utilized to designate any experimental or abstract animation, it is frequently employed to define any commercial usage of animation and its impact in film, video, TV, and interactive applications.
Animated elements are designed using graphics technology known as the particle system. For particle systems, standalone apps, plug-ins, and motion picture packages are available. A sphere of light, a video clip, or a piece of text can all symbolize particles or points in two or three dimensions of space. Depending on the project, a particle emitter may discharge hundreds or thousands of fragments. A particle emitter can be a single point, line, grid, plane, or custom thing like a logo that can be ignited, erupted, or transformed into swirling sand. It can also be a single point, line, grid, plane, or object like a box or sphere. A standard particle system is the Trapcode Particular.
Depending on the software’s capability, multiple approaches can be utilized to animate specific elements of a motion graphics project. For instance, Art, writing, images, and video snippets illustrate these components. The most popular form of animation is keyframing, where the attributes of an object may be defined at specific periods by establishing a series of “key frames” such that the object’s properties may shift seamlessly within critical frames.
Any presentation that efficiently and consistently combines text, images, sounds, animation, and video is referred to as “multimedia.” (Abdulrahaman et al., 2020)
Five advantages of multimedia education include:
- “Deeper comprehension”
- Improved problem-solving;
- Increased feelings of pleasure
- There is a wealth of information available.
- Worldwide Exploration
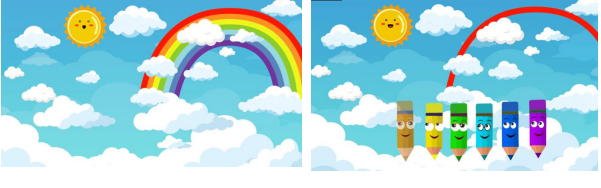
The conventional methods restrict students to text reading, lecture listening, and seminar discussion. Nevertheless, multimedia techniques could increase students’ participation in class, enhancing comprehension in various ways, including giving them an active task to complete and providing supplemental watching or listening materials (Haleem et al., 2022). Using music with animations and other interactive elements is one way to increase interaction. This study assesses the impact of multimedia instruction on students’ learning by developing a unique narrative that uses a rainbow as a genuine illustration of the visible light spectrum to clarify visible light’s wavelength, frequency, and energy level.
Literature Review
As Hanna and Coman (2021) demonstrated, motion graphics could be helpful if they are thoughtfully created and simple to understand. Although motion graphics can help with studying, static graphics are frequently preferable to motion graphics. The motion graphics provided comprehensive details regarding the tiny steps that separate the bigger ones. However, animations have frequently failed because they needed to be easier to understand. In a study, Makarova (2021) contrasted the efficiency of teaching digital content with traditional education. According to their research, teaching with digital content is equally productive as teaching with conventional materials at the knowledge level. However, it is more effective at the understanding and application levels.
Leow developed the “Multimedia-mediated Student-Centered Learning Environment” (MMSLE), an interactive multimedia learning approach, to enhance student learning quality. To evaluate the effects of the MMSLE approach, pre-and post-tests, questionnaires, open-ended questions, and interviews were employed. The test findings revealed a significant improvement in student learning and classroom participation (Basilio & Sigua, 2022). The findings of a study on the effects of multimedia learning on the creative thinking abilities of a group of mechanical engineering students are presented by Kassim. The Index of Learning Style (ILS) identified students’ learning styles. Using the Torrance test of creative thinking (TTCT), Kassim evaluated the effectiveness of multimedia learning resources. The results showed that “active, reflective, intuitive, and high visual students” gained more from adopting multimedia in their education.
Regardless of the conventional approach, which prioritizes the role of teachers and instructors, the introduction of technologies has improved learning. The inclusion of technological media in what is referred to as “multimedia” was the trend that gave rise to a limitless number of methods for utilizing computer technologies. The idea for this technology first came about with sound cards and compact discs. Then came the development of digital cameras and video, making the computer a crucial educational tool. Since it has developed so much, multimedia has become a distinct field. Utilizing technology for multiple purposes is a concept that has been introduced previously. Multimedia programming could provide a more influential and successful experiment than using each instrument separately. Because it engages multiple senses concurrently, researchers regard multimedia as one of the most successful teaching methods. Multimedia makes use of either sight or sound, for instance. In how they are presented, multimedia programs provide various forms of stimulation, including various things (Abdulrahaman et al., 2020), which entail: Texts, Spoken language, music and sound, Graphics, Animations, and static images. These elements were included in a coherent presentation to provide high-quality instruction that motivates students to use their senses to engage in various curricula (Lowell et al., 2020). The following are some benefits of the multimedia teaching approach:
- Using these tools, reading becomes an interactive experience rather than a passive one (Ugur, 2020).
- Different illustrations and photographs can help communicate information and clarify concepts.
- It is easy to transition from one stated topic to another, which gives room for inquiries and conversations.
- The content is brought nearer to reality by combining multiple presentations, such as video footage, with maps or other displays. The idea is made more explicit, and the learners’ attention is captured by adding music.
- They increase learners’ interest in and engagement with academic subjects (Puspitarini & Hanif, 2019).
- They include excitement and anticipation components.
- They are ranked from easy to difficult based on the learner’s capacity.
- They offer innovative instructional strategies to teachers and promote inquiry (Matuk et al., 2019).
- The vast amount of information each topic contains assists educators and students in thinking broadly about various subjects (Matuk et al., 2019).
- They direct students toward collaborative learning (Matuk et al., 2019).
- They are worried about giving concurrent feedback.
- They aid in students’ retention and application of knowledge (Narayan et al., 2019).
- Both students and teachers must have access to a computer since it promotes the users’ creativity and productivity.
The components used in multimedia have all been around for a while. Essentially, multimedia combines these components to produce a powerful new tool, especially in the hands of teachers and students. The demand for different learning styles increases as more complex technological tools become available.
The present survey aims to identify possible uses of motion graphics in the educational setting. Additionally, we demonstrate how motion graphics open up new opportunities for educators in the teaching and learning fields. Are there any differences in the outcomes for students who receive motion graphics instruction versus those who receive traditional instruction?
Methodology and Data Collection
Pre-tests and post-tests were employed in the present investigation because it was an experiment. The overall objective of this study was to examine how well students learning color theory using motion graphics and students learning color theory using traditional methods learned the subject matter. Class A and Class B, each with 15 students, were chosen from the 8th graders of S. M. School. Eighth graders were chosen for the survey since they had not studied the color theory lesson. If we had chosen their seniors, their color knowledge would have influenced our findings because they had already passed the color theory course.
An innovative narrative regarding rainbow colors, wavelength, energy, and frequency was composed to offer imaginative opportunities for teaching and learning. Multimedia and Digital Art also add to knowledge development and ease of learning. The survey’s instrument was a researcher-made test with ten questions regarding the principles of the visible light spectrum from the color theory lesson.
The visible light spectrum is the subject of choice for color theory because the rainbow offers a basic and authentic illustration of its wavelengths. A rainbow can be seen when the sun is behind us, and rain is in front of us. At a raindrop’s surface, sunlight that strikes it is also refracted and divided into wavelengths. Consequently, a rainbow of colors is visible in the sky.
Characterization and graphics for the rainbow-colored story were completed after the writing was completed. Then, the characters were animated, and the story plots were created. The scripts for each character, the narrators, and the voiceover have all been recorded, and a few additional graduate students have requested to read them. The video was posted on Vimeo and is accessible on the.
Research Hypothesis
The impact of motion graphics versus conventional techniques on learning differs significantly. It is a prevalent belief that motion graphics can make learning, comprehending, and drawing conclusions easier.
Sampling
Sampling is done to gather the necessary information regarding community members and calculate the society’s values using sample values. Sampling makes research achievable and straightforward while also saving both time and money. A census-style procedure will be used if the researcher surveys each segment of the community.
Every member of society must be examined and tested separately by the researcher. It is often not advised to wrap up the count (for data collecting) due to the expense, labor, and time involved. In general, the portion of the population that ought to be in the sample should increase as the population size decreases, and decrease as the population size increases. The researcher should choose nearly the entire population as a sample if the population is 30 or fewer. Use the census approach; in other words, due to the limited population size in our research, all population members were examined using the census approach.
Validity and Reliability
Validity describes how effectively an instrument assesses the variables it is intended to assess. The instructors who presented this topic in the classroom validated the test. Like validity, reliability is a way to assess how well a dissertation’s data collection methods were done. A study’s measurement process must be trustworthy before the findings are valid. The test was administered to 15 students to evaluate the accuracy of the questions.
Split-half test
The technique involved dividing a test into two halves and measuring the correlation coefficient. To use this approach, incorrect responses were given the code 0, and correct ones were given the code 1. In this way, the questions’ topic and level of complexity were comparable. Two groups of tool questions made up the entire set of questions. Cronbach’s alpha or Split-Half was employed to assess validity using SPSS, a popular statistical analysis program. The reliability Correlation Coefficient between the scores of the two tests was 0.56, and the reliability Correlation Coefficient of the whole test was 0.72.
2*0.56 / (1+0.56) = 0.72.
Descriptive Statistics and Inferential
Descriptive statistics were applied to describe the data, and inferential analysis (t-test) was used to compare group means to identify and explore the substantial distinction among the categories. Before instruction, a pre-test was administered to both groups of students to assess whether they were on the same level in the subject and whether there was a substantial disparity in the means of their pre-test scores. After the instruction, the students were given the post-test questions to gauge their understanding using the mean.
The topic of the visible light spectrum from the class on color theory was provided to classes A and B. Class A used the conventional approach. In contrast, class B adopted motion graphics, and both classes then responded to the questions. The T-test was applied to analyze the variance in score means. The post-test results revealed that the two groups’ means of scores increased following instruction, with an apparent distinction between the means of class A and B scores in the post-test phase. The average class B scores taught via motion graphics were higher than the average class A results.
- Dependable Variable: Motion graphic tools.
- Independent Variable: Success in learning.
- Variables that should be controlled: Class teacher, class location, students’ knowledge level, and middle school.
Descriptive indices (mean and standard deviation) of eighth graders and color theory scores were calculated in the pre-test and post-test phases using standard methods and graphic motion; the findings are shown in Table 1.
The preceding table’s outcomes demonstrate no significant distinction between the pre-test mean scores for classes A and B. In the post-test, the two groups’ color theory scores rose; the following graph compares the mean color theory scores across the two groups for both the pre-test and post-test.
The mean scores of the students in class A’s pre-traditional teaching and those in class B’s post-motion graphic instruction are equal.
The Levene test shows that the two groups have equal variances, and because the significance level is 0.789, the two groups’ means are likewise equal. After receiving teaching in both the conventional manner and using motion graphics, the mean scores of the class A students are equal.
The Levene test indicates that the variances of the two groups are equal, and since the significance level is 0.047, the disparity in the means of the two groups is substantial.
Conclusions
Numerous studies have been carried out to examine the use of multimedia in learning from various perspectives. It is evident that in today’s digital age, the potential of motion graphics is understood. Motion graphics can convey information through sound, image, motion, and a story. They may also be used to develop innovative teaching strategies and foster student creativity. This study used conventional techniques in class A and multimedia methods in class B, selecting two undergraduate student classes as sample data.
The median pupil score in both classrooms was comparable before introducing color theory, indicating pupils had no prior understanding of color theory. The F-test and t-test were used to prove this hypothesis, and the results are shown in Table 2. The p-value (0.0592) is more significant than 0.05, indicating no difference in the students’ levels of knowledge. On the contrary, the p-value (= 0.035), which is smaller than alpha (= 0.05), indicates that class B students’ grades were considerably higher than class A students’ grades when the color theory was introduced through conventional techniques. The post-test findings are shown in Table 3 below.
Recommendations for Future Research
According to the findings, motion graphic educators and designers should focus more on properly communicating the lesson when creating motion graphics. Schools should also provide an appropriate platform to teach teachers new teaching methods. This phenomenon is because by designing reasonable and logical motion graphics, we typically make the educational experience for students more accessible.
One of the most crucial things is to make an educational motion graphic that considers the audience’s age in both the characters and the motion graphic’s structure. To put it another way, the tone and graphics should speak to the same demographic. Students aware of this possibility may decide not to pay attention if it does not communicate to them at their educational level.
As a result, the situation may worsen since they tune out because they think they are being talked down to. Older teachers may find it challenging to learn how to create motion graphics using modern software. Animators and graphic designers can assist them. For motion graphics professionals to develop an instructional motion graphic, senior teachers could describe the lesson’s topic to them.
References
Hanna, M., & Coman, N. (2021). Motion graphics in relation to branding – diva-portal.org. Motion Graphics In Relation To Branding. Web.
Abdulrahaman, M. D., Faruk, N., Oloyede, A. A., Surajudeen-Bakinde, N. T., Olawoyin, L. A., Mejabi, O. V., Imam-Fulani, Y. O., Fahm, A. O., & Azeez, A. L. (2020). Multimedia tools in the teaching and learning processes: A systematic review. Heliyon, 6(11). Web.
Basilio, C. R., & Sigua, E. M. S. (2022). Development and validation of multimedia-based Instructional Module in science 7. Zenodo. Web.
Haleem, A., Javaid, M., Qadri, M. A., & Suman, R. (2022). Understanding the role of digital technologies in education: A Review. Sustainable Operations and Computers, 3, 275–285. Web.
Lowell, B. R., Cherbow, K., & McNeill, K. L. (2020). Redesign or relabel? how a commercial curriculum and its implementation oversimplify key features of the NGSS. Science Education, 105(1), 5–32. Web.
Makarova, E. (2021). Effectiveness of traditional and online learning: Comparative analysis from the student perspective. SHS Web of Conferences, 99, 01019. Web.
Matuk, C., Hurwich, T., Spiegel, A., & Diamond, J. (2019). How do teachers use comics to promote engagement, equity, and Diversity in science classrooms? Research in Science Education, 51(3), 685–732. Web.
Narayan, V., Herrington, J., & Cochrane, T. (2019). Design principles for heutagogical learning: Implementing student-determined learning with mobile and social media Tools. Australasian Journal of Educational Technology, 35(3). Web.
Puspitarini, Y. D., & Hanif, M. (2019). Using learning media to increase learning motivation in elementary school. Anatolian Journal of Education. Web.
Twyman, J. (2018). Digital technologies in support of person alized learning. Eric – Education Resources Information Center. Web.
Ugur, N. G. (2020). Digitalization in higher education: A qualitative approach. International Journal of Technology in Education and Science, 4(1), 18–25. Web.