Biostatisticians often experience research-based situations where they are expected to observe the counts of events that occur within a set unit of time, such as the number of reported cases of cholera in different cities or the number of children born per hour in any given day. In such contexts, biostatisticians may use the Poison distribution to estimate whether these events occur randomly or indiscriminately in time or space (Pagano & Gauvreau, 2000). This paper provides a technical definition and a general description of the Poisson distribution and how estimations for the Poisson distribution are made.
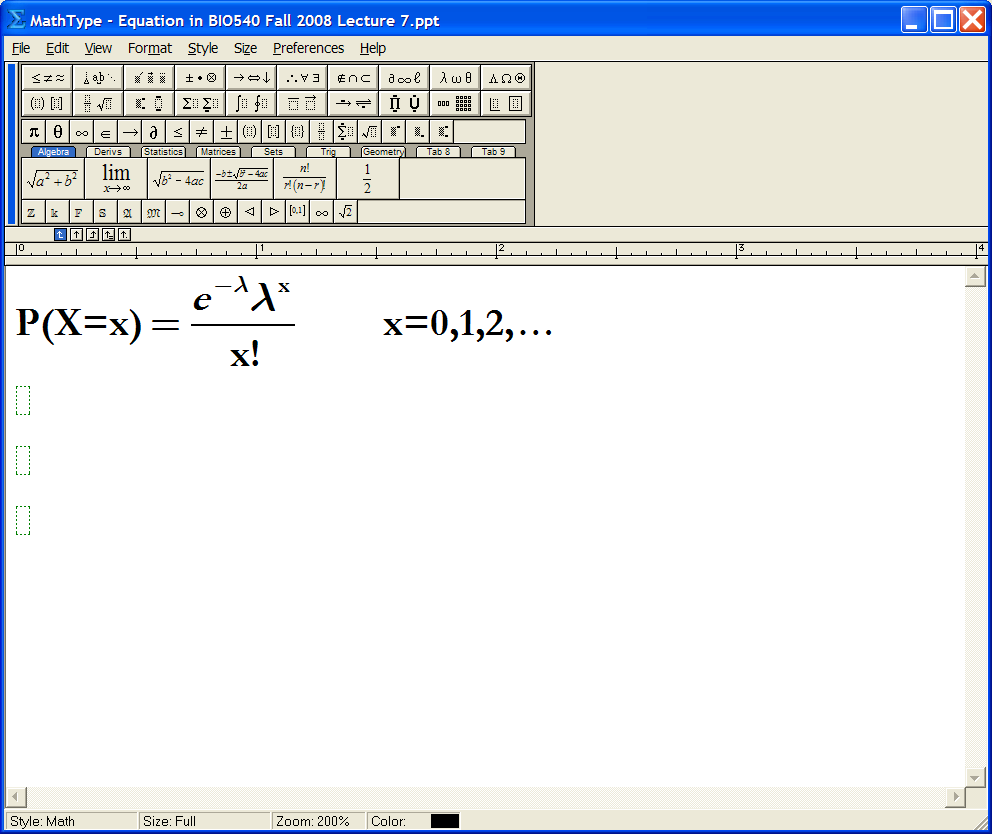
The Poisson distribution is technically defined as “a discrete probability distribution for the counts of events that occur randomly in a given interval of time (or space)” (Rosner, 2015, p. 86). Researchers have observed that most Poisson distributions are unimodal and display a positive skew that decreases as the mean number of events per interval increases. Additionally, Poisson distributions are not only centered roughly on the mean number of events per interval but their variance or spread expands as the mean number of events per interval increases (Pagano & Gauvreau, 2000). Poisson distributions assume that (1) the likelihood that an event will occur in the time or space interval provided is proportional to the length of the interval, (2) an infinite number of occurrences or events can occur in the specified time or space interval, and (3) events occur independently at a mean number of events per interval (Rosner, 2015). Based on the above information, the mathematical formula for estimating Poisson distributions is as follows: (“X = number of events in a given interval”; “λ = mean number of events per interval”; “e = mathematical constant ≈ 2.718282”; “x = probability of observing events”) (Rosner, 2015, pp. 86-87).
In general terms, the Poisson distribution can be described as a form of probability distribution that uses discrete values or variables to show the likelihood of a specified number of events happening in a predetermined interval of time and/or space even when these events are set to happen at regular intervals that are independent of time considerations for the last event. For example, a public health official may use records to show that the department receives an average number of 20 complaints per day from citizens who are unhappy with the public water system. However, if in one particular day the public health official receives more complaints coming from a broad range of sources and arriving independently of one another, then it can be reasonably assumed that the complaints received per day follow a Poisson distribution since an infinite number of complaints are possible in any given day. From this description and example, it is clear that public health officials can use estimations for the Poisson distribution to evaluate the likelihood of a set of independent events or experiences taking place in a predetermined time-frame and/or space.
Overall, it can be concluded that the Poisson distribution is a useful application for statisticians when it comes to estimating the likelihood of a number of autonomous events occurring in daily research settings and experimental contexts. Although the length of the interval or time-frame is of immense importance in determining the probability of an event occurring, it is important to remember that an infinite number of events or incidences can take place in any specified time-frame.
References
Pagano, M., & Gauvreau, K. (2000). Principals of biostatistics (2nd ed.). California: Duxbury Press.
Rosner, B. (2015). Fundamentals of biostatistics (8th ed.). Boston, MA: Cengage Learning.