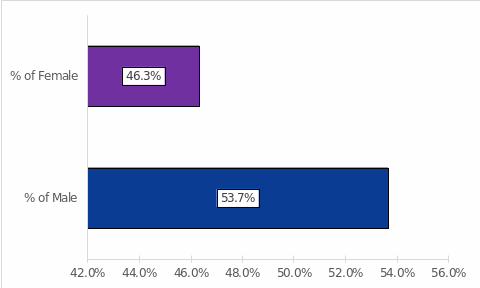
MS Excel software can be used to produce thematic visualizations that simplify the ability to draw conclusions and identify key trends based on distributions. A business idea exploring statistical patterns to test viability is the use of a buggy — like a golf cart — on a university campus to move students between buildings more quickly. This is a paid service, offering students, in return, the comfort and speed of moving across vast academic areas. Thus, one of the first descriptive statistics was gender, a categorical nominal variable. Turning to Figure 1 demonstrates that 53.7% of respondents (n = 22) identified themselves as male, while the number of women was 15.8% lower, that is, only 46.3% (n = 19) of women in the study group. This trend by itself tells us nothing about the opportunities or barriers to pursuing a business idea, but it does provide initial clues about the nature of the sample, which can then be used. For example, if buggies on campuses do get introduced, it can be inferred from the gender distribution that there is a relative equality of opportunity for students of different genders to use it.
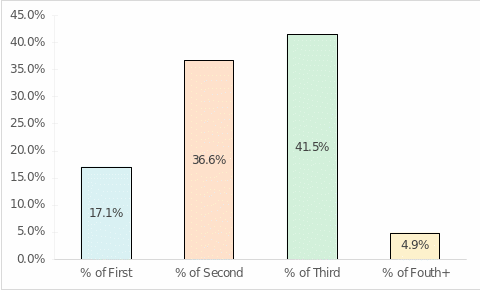
In addition, a descriptive characteristic of the sample was the respondents’ year of education, determining their experience with territories and academic life. Characterizing such experiences is necessary because it may indirectly reflect the target audience to be relied upon for the business idea. For example, unfamiliar with the territories, applicants and first-year students could use the buggy experience more often because they need to save time exploring the territories, so they are not late for class. On the other hand, upper-level students might use this mode of transportation because they are more likely to be more solvent due to the combination of study and work and might value comfort more in routine activities. Turning to Figure 2 demonstrates this distribution by age. The most significant portion of the sample is represented by third-year students who comprised 41.5%, followed by sophomores (36.6%), first-year students (17.1%), and seniors (4.9%).
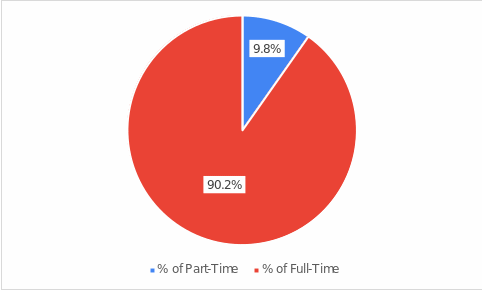
A critical statistic was also the definition of students’ academic status in terms of part-time and full-time employment. This characteristic suggested the relevance of buggy services on campus based on students’ employment — if they appeared to be full-time, then the downtime of the buggy during the day might not be feasible. Figure 3 shows that as many as 90.2% of respondents had full-time academic employment, and only 9.8% of the sample classified themselves as part-time individuals. This creates a condition in which the schedule of buggy services needs to be carefully planned since the maximum flow of clients is expected in the morning when most go to university, at lunchtime, and in the evening when most go home; in this sense, there is no need to keep several active buggies at intermediate intervals.
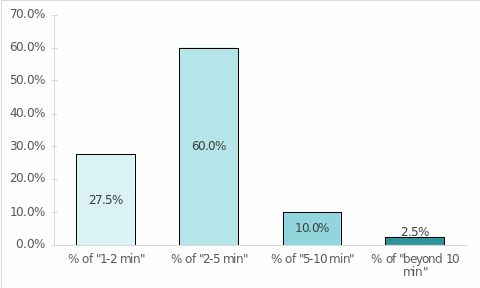
Gender filtering is also used to determine the maximum amount of time that individuals are willing to wait for buggy. This parameter is fundamental because waiting in a dynamic world is a complex phenomenon that hinders business efficiency. Customers do not like to wait long for their Uber, ordered pizza or goods — if the wait is more than some allowed in their head threshold, the company loses the loyalty of such a customer. The same is true for buggy waiting, because the initial concept of this business is to save a lot of time. There would be no effect or benefit in such savings if the customer waited longer for a pre-paid buggy than if he had walked himself. The idea of gender separation also does not seem unconstructive since any business seeks to increase customer loyalty through personalization of services. Personalization helps create a focus on a particular customer and thus increase customer engagement with the brand. For buggy businesses, the idea of exploring gender differentiation in maximum buggy wait times will identify common patterns among men and women. If one group can afford to wait longer, this can be used in the business’ operational decisions to reach as many customers as possible. In other words, if it turns out that men can wait 5-10 minutes longer than women, the buggy driver can give the girl a ride first and then quickly come back for the guy — everyone wins in this situation. First of all, it should be turned to general statistics for maximum waiting time: as one sees from Fig. 4, the majority of the sample (60%) is ready to wait from 2 to 5 minutes, while only 2.5% of individuals are ready to wait more than 10 minutes. Together, this leads to the conclusion that out of ten individuals, approximately 9 (87.5%) were unwilling to wait more than five minutes, and approximately 3 (27.5%) could only afford to wait up to two minutes. Between 5 and 10 minutes of waiting time was acceptable to 10% of respondents.
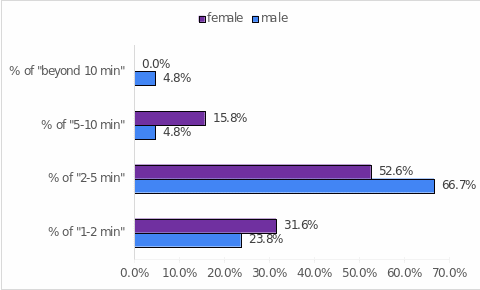
In terms of gender filtering (Figure 5), it was found that women were not willing to wait more than ten minutes at all, with most women (52.6%) as well as most men (66.7%) being able to wait from two to five minutes. Women were more often willing to wait 5 to 10 minutes and 1 to 2 minutes than men. Based on this, operational decisions can be tailored to gender differentials. For example, if a driver is asked whether to pick up a woman in 2 minutes or 5 minutes, and whether to pick up a man in 5 minutes or 10 minutes, the choice should be based on the statistics obtained.
