Abstract
This paper analyzes financial data for a cookie company using several accounting principles and standards. The report is divided into six sections, each analyzing a distinct component of the company using the Unit VII Spreadsheet Template in Excel. The first step is to figure out what the contribution margin (CM), weighted average CM, and breakeven point are for each cookie flavor. The second portion assesses the value of remaining inventory using full- and absorption-costing, as well as variable-pricing methods.
Part three examines the net profit increase/decrease for a particular order of cookies and presents qualitative and quantitative decision criteria. Part four computes the internal rate of return (IRR) for new equipment and assesses the ethical problems of acquiring the equipment. Part five estimates first-quarter cash receipts and examines the company’s cash-collecting method.
Part six, finally, examines material and labor discrepancies and recommends solutions to improve them. Some of the observations include: The firm has to sell a lot of cookies to break even due to its high fixed costs. A tiny price adjustment may have a big influence on income, thus cookie pricing is crucial. Based on these findings, cookie recommendations for businesses include: To optimize sales and profit, analyzing cookie prices. Exploring ways to reduce ingredient prices, such as switching suppliers or obtaining better deals.
Introduction
The long-term health of a company depends on an accurate financial assessment. This report will apply accounting principles and standards to the financial data of a cookie company to draw meaningful conclusions. The contribution margin, breakeven threshold, inventory costs, special orders, capital equipment purchases, cash budget, and variations are all calculated and detailed in the report. It will review the numbers, make suggestions based on our findings, and call out some ethical issues. This paper contains thoughtful analysis of data for use in making crucial business decisions.
Contribution Margin/Breakeven
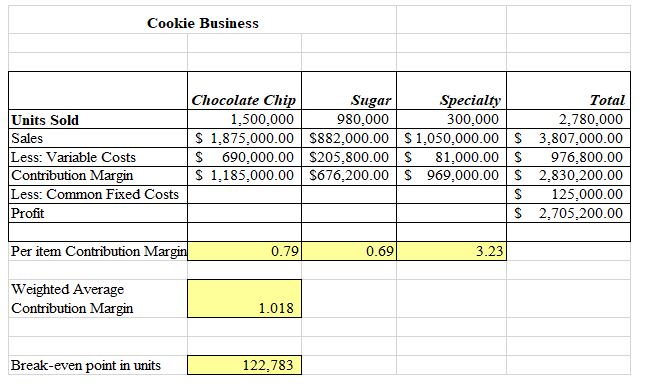
Each product’s per-item contribution margin covers fixed expenses and generates a profit after variable costs, where Chocolate Chip contributes $0.79 per item, Sugar $3.23, and Specialty $0.69, as depicted in Table 1. The company may want to promote this cookie more or raise the price to maximize profit. However, the special cookie has the lowest per-item contribution margin, suggesting that the firm may want to rethink manufacturing or lower its variable expenses.
The weighted average contribution margin is $1.017. Each item sold covers fixed expenses and generates $1.017 in profit. The weighted average contribution margin may be used to assess how many units a firm must sell to make a specific profit. The number of units a company must sell to break even is its breakeven point, which is 122,724.47. The breakeven threshold may also assess corporate plans like entering new markets or buying new equipment (Sintha, 2020). The breakeven point may be used to quantify how many units must be sold at a specific price to make $100,000.
Full and Variable Costing
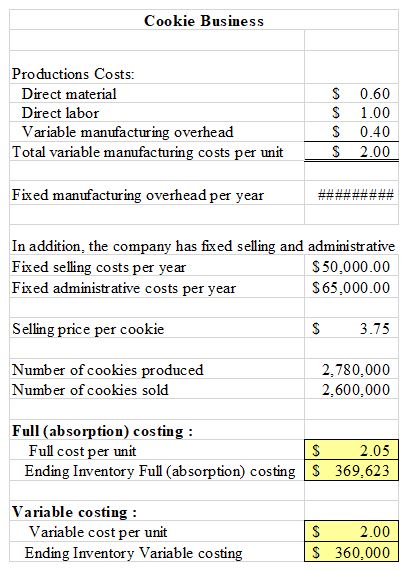
The full price includes direct goods, direct labor, and overhead. The cost of making cookies is $2.05. The company must pay $2.05 for each cookie to offset production costs, as indicated in Table 2. Inventory is reduced to $369,623 due to full (absorption) expenses and includes variable and fixed production expenses for cookies in inventory at the end of the fiscal quarter. This figure indicates costs that still need to be allocated to the cost of goods sold, which assists the business in determining its profitability. Variable pricing only applies to direct materials and labor used to create a product. The company must pay $2.00 for each cookie to cover variable expenses.
After the accounting period, the cost of cookies in inventory consists only of variable production expenditures. This value assists the company in evaluating its contribution margin, the difference between sales revenue and variable expenditures, and making pricing and production decisions. According to Table 2, Full (absorption) costing considers variable and fixed costs, while Variable costing just considers variable costs. The final inventory values of the two costing approaches may impact the financial statements and profitability of the firm (Aitken-Davies, 2020). As a result, the company must carefully choose a costing technique and understand its financial implications.
Special Order
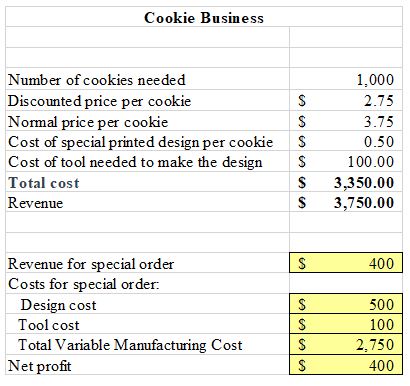
According to the information presented, the cookie firm got a $400 special order. This order included significant expenditures, including $500 for design and $100 for tools as indicated in Table 3. Net profit was $400 due to the $2,750 variable production cost. The cookie firm made some money from the special order, but the production expenses were significant, resulting in a low-profit margin. Since variable manufacturing costs were high, the company may need to change its production or pricing strategy to boost profits. The cookie firm must continuously manage expenses and profit margins to save money on customized orders. Analyzing each order’s expenses and earnings may also assist the firm in improving efficiency and profits.
Internal Rate of Return
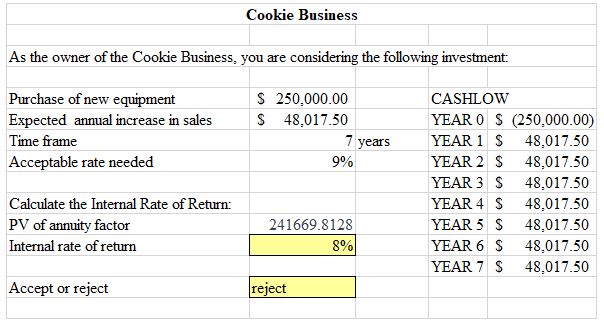
Table 4 depicts that the needed rate of return is 9%; however, the supplied IRR is 8%. The investment should be rejected since the IRR is below the necessary return. IRR measures investment profitability. The rate of return renders an investment’s net present value (NPV) zero. If the IRR is more than the needed rate of return, the investment is lucrative and acceptable; if it is lower, it should be rejected (Hazen & Magni, 2021). The IRR is an important indicator in the cookie industry since it evaluates the profitability of its investments. The corporation can only invest in investments with a greater IRR than the necessary rate of return. The firm may optimize profits and growth by selecting the most lucrative investments.
Cash Budget
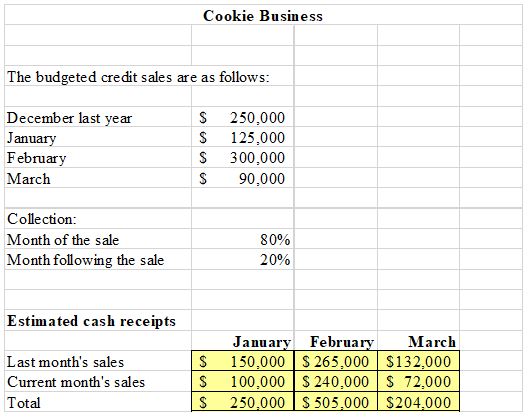
Based on planned credit sales and collection time, the cookie business’s predicted cash revenues for January, February, and March are shown. January cash revenues are projected at $250,000, matching December credit sales. This signifies that the firm has collected all revenues from the previous month, improving cash flow. February cash revenues are expected at $505,000, more than January and December credit sales, as indicated in Table 5. This rise in cash receipts shows that consumers pay their invoices on time, boosting cash flow (Aitken-Davies, 2020).
March cash revenues are expected at $204,000, lower than February credit sales. The firm is still collecting on February credit sales due to the collection period. The firm may have a cash flow issue due to a drop in cash receipts, but this is common and can be addressed with cash flow planning.
Material and Labor Variance
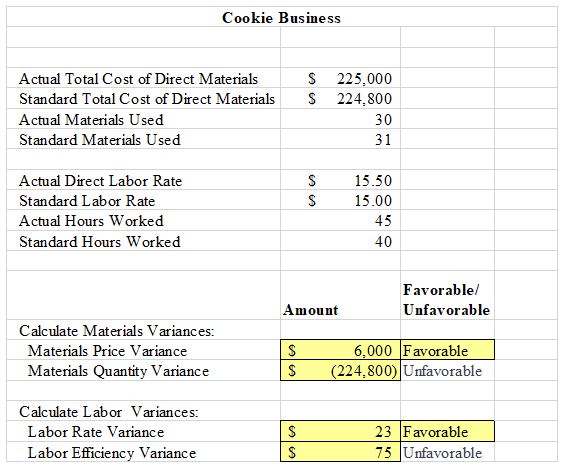
The company reported a $6000 positive variance starting with the material price variations. The company bought their direct materials less than planned. The company utilized more direct materials than projected, resulting in an unfavorable materials quantity variance of $(224,800). The firm had a $23 favorable labor rate variance, meaning it paid its workers less than the regular wage, as shown in Table 6. However, the firm had a $75 labor efficiency variance, suggesting that its staff needed to be more efficient and took longer to do the task. These differences help the cookie company find areas for improvement and success. The company may explore why it used more direct materials than intended and take action to eliminate waste or enhance manufacturing. It may also investigate why its workers were less productive and provide training or assistance.
Conclusions and Recommendations
The study provides an analysis of the cookie industry, focusing on revenue and cost factors. The following are the important observations based on the calculations. To break even, the firm must sell a lot of cookies due to its high fixed costs. The price per cookie is an important aspect in calculating revenue since even little pricing changes may have a large influence on total income. The company has a high gross margin, indicating that it has the potential to be lucrative. Ingredient costs are a substantial expenditure for the firm, and there may be ways to reduce ingredient prices.
Based on these discoveries, potential future cookie business proposals include: Conducting more research to identify the best pricing per cookie to maximize sales and profit. Investigating ways to reduce ingredient costs, such as getting products from multiple vendors or negotiating lower pricing. Consider increasing the product range or seeking new markets to boost the amount of cookies sold. Fixed costs must be monitored and managed to ensure they do not become a barrier to profitability. Following these recommendations will boost the cookie company’s long-term success and profitability.
References
Aitken-Davies, R. (2020). The cash forecast. Handbook of financial planning and control, 101–108. Web.
Hazen, G., & Magni, C. A. (2021). Average internal rate of return for risky projects. The Engineering Economist, 66(2), 90–120. Web.
Sintha, L. (2020). Importance of breakeven analysis for the micro, small, and Medium Enterprises. International Journal of Research -GRANTHAALAYAH, 8(6), 212–218. Web.