Current Ratio
Current ratio is one of the financial ratios indicting the liquidity of the firms over the short-term. Current ratio is defined “as a class of financial metrics that is used to determine a company’s ability to pay off its short-terms debts obligations. Generally, the higher the value of the ratio, the larger is the margin of safety that the company possesses to cover short-term debts.” (Investopedia, 2010.)
The current ratio is an indicator to provide the information and analysis about the capabilities of the firm to meet its short-term financial obligations. The current ratio guides the lenders who want to advance monies to the companies on a short-term basis. This ratio compares the current asset position of the companies with the current liabilities and enables the determination of the liquidity of the company. Thus, the purpose of calculating the current ratio is to evaluate the short-term liquidity the company. The current ratios of PepsiCo and Coca-cola are shown below.
The liquidity of both the companies appears to be low. In general, a ratio of 2:1 between the current assets to current liabilities is considered sound and safe. However, the industry average ratio of 1.3 indicates that both the companies do not have any short-term liquidity issues. In fact, while the current ratio of Coca-cola is just near the industry standard, the ratio of PepsiCo is higher than the industry average indicating that the company is comfortable in respect of its ability to meet its current liability obligations. However, the types of the current assets and their liquidity position are addressed clearly with the “acid-test ratio” which includes only easily realizable current assets to compare against the current liabilities.
Profitability
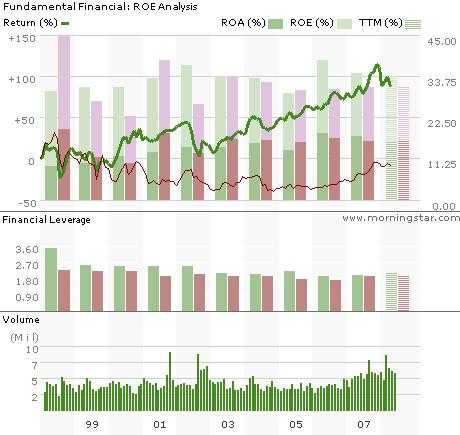
The ability of a firm to generate profits can be assessed by working out the profitability ratios for a historical period and by analyzing the sources of income. The gross profit margin, operating profit margin, and net income as a percentage of total turnover present a realistic view of the firm’s ability to generate profits. In general, the profitability ratios offer several different measures of the success of the firm in generating profits (NetMBA, 2002). The profitability of the company can be assessed by working out the ratio of net income to total assets (Return on Assets – ROA) and net income to shareholders’ equity (Return on Equity – ROE).
Both the companies have performed almost similarly in terms of their return on the total assets. This implies that companies have a strong presence in the market and are able to maintain their profitability at constant levels, as the return ratios for the past three years have been consistent.
For PepsiCo, the return on assets has shown a sharp decrease in the year 2008 as compared to 2009, whereas the ratio was improved in the year 2009 to some extent. The return on equity has gone up in the year 2008 implying that the company was able to provide more returns to the shareholders. This ratio has gone down sharply in the year 2009.
For Coca Cola, the return on assets is consistent over the past three years, which implies that the company is able to maintain its market position and profitability on a consistent basis. Similarly, the company has been able to maintain the return on equity also consistent over the period, assuring constant returns to the shareholders.
Cash Flow Indicators and Investment Valuation Ratio
The cash flow indicators and investment valuation ratios are the indicators of the perceptions of the shareholders about the profitability of the company and its ability to provide a satisfactory return to the shareholders.
Generally, a high price-to-earnings ratio suggests that the investors are expecting an enhanced earnings growth in the future as compared to other companies having a lower price-to-earnings ratio. However, price to earnings alone cannot help the investor to take decisions about investments. The dividend payout ratio, which takes into account the yearly dividend per share and the earnings per share informs about the quality of the company in respect of its dividend paying ability.
The consistency in paying dividends is one of the important elements influencing the decision of the investor. In this respect, the dividend payout ratio for Coca-Cola is more than that of PepsiCo and the company has been consistently paying higher rates of dividends to the shareholders. The higher price-to-earnings ratio of Coca-Cola indicates that the shareholders are expecting the company to have a higher earnings growth for the future. The price-earnings ratio also indicates how much the shareholders are willing to pay per dollar of earnings. From this view, also the shareholders of Coca-Cola are most likely to be satisfied ones.
Investment Decision
It is a difficult decision to consider whether to invest in the stocks of Coca-Cola or PepsiCo. This is because each company has a sound market position supported by solid brand name and a number of popular products selling across the globe. The stocks of both the companies have been the center focus of the market for the past several years. Both the companies have a strong domination over the sector controlling 75% of the market share together.
As an investor, I will consider investing in the shares of PepsiCo, as the company has been consistently providing higher returns to the shareholders’ equity. The investors cannot consider the price-to-earnings ratio alone in their investment decisions. The earnings figure, which goes into the calculation of the price-to-earnings ratio, is an accounting measure, which is susceptible to different forms of manipulation.
In addition, the sales revenue for PepsiCo is more than that of Coca-Cola because of different product ranges the company has taken for diversification. Coca-cola has just stopped with beverages. PepsiCo has been able to turn around its fixed assets 5.2 times while Coca-Cola has been able to turn over the fixed assets 3.24 times only. This implies that PepsiCo has been able to make an effective utilization of its fixed assets as compared to Coca-Cola.
A close look at the strategies and performance of the companies provides a strong support to the stocks of PepsiCo for investing (Dlugosch, 2010). Despite the low payout ratio, the market price of the shares of PepsiCo are higher than that of Coca-Cola, which also points in the direction of investing in the shares of PepsiCo. The following figure supports my decision to invest in the shares of PepsiCo.
Non-Financial Criteria
Apart from the financial considerations, several non-financial criteria need to be considered in deciding to invest in the shares of PepsiCo and Coca-Cola. The first criterion is the market reputation and market share of the companies. The ability of the company to generate large cash flow through broader product line is another consideration, which will make the investment worthy. This would create synergy for the company, which goes beyond the board.
The distribution capabilities and expansion into different geographical regions and the marketing intelligence to ensure the growth of the company are some of the other non-financial considerations, which could influence the decision to invest in the stocks of any of these companies. Diversifying into different product areas adds to the strength of the company. In addition, the types and classes of assets and their intrinsic value also play a major role in the investment considerations.
The qualities, culture, business ethics, and adherence to social corporate responsibilities also need to be considered to know the real value of the stocks in any company. The employment policies of the company and the qualities of the company as an employer can guide the investment decisions apart from the purely financial considerations.
References
Dlugosch, James (2010), Coke or Pepsi: Which Stock to buy? Moneycentral.msn.com. Web.
Harkonnen (2009), Comparative Financial Analysis between PepsiCo and Coca-Cola. Web.
Investopedia, (2010), Liquidity Ratios. Web.
NetMBA (2002), Use and Limitations of Financial Ratios. Web.