Knowledge and Risk
‘Knowledge can be divided into uncertainty and perfect knowledge. Where does risk fit into this spectrum?’
According to several sources, knowledge can be defined as the relation between two or more ideas that are usually perceived mentally (Reany, 1988). Naturally, such ideas or concepts do not exist separately from the conceptualizer; hence, human knowledge is established as being subjective and without an absolute meaning. On the other hand, physical concepts are usually free creations of the individual’s mind and are not ideally established by the outside environment.
In 1689, John Locke gave the first definition of knowledge as the perception of the agreement or disagreement between two different ideas, which has since been improved by several writers. Davenport and Prusak (1998), for instance, described knowledge as “a fluid mix of framed experience, conceptual information, values and expert insight that provides a framework for evaluating and incorporating new experiences and information.”
In connection, knowledge usually has various characteristics and may be categorized as uncertainty or perfect knowledge (Stirling & Ian, 2009; Zack, 1999). Similarly, risk has another close association to the development of human knowledge and may have a huge impact in its overall effect (Chisholm, 1989; Williamson, 2000). In particular, risk is defined as the possibility of a loss or injury while uncertainty refers to the indefinite aspect of knowledge, which is not known beyond doubt. According to Rose (2001), the difference between risk and uncertainty stands for a positive chance that something bad may occur. On the contrary, uncertainty will not always ascertain a value rating or judgment of the potential results. In common usage, however, both terms generally refer to the same idea, which holds that a certain part of the future remains unpredictable.
In other disciplines such as economics, risks and uncertainty assume different definitions; hence, makes the difference between the two definitions to increase (Almeder, 1998). As a matter of fact, risk is usually present when future events take place with much more probability than expected. Similarly, uncertainty is present where the probability of future activities becomes indefinite or cannot be measured through calculations. This distinction was identified while analyzing profit, as well as the potential origins of the term (Rose, 2001).
In the same way, standard economic theory holds that in a market of perfect competition where all concerned partners have perfect knowledge; individuals will buy and produce at zero profits. This comes about due to the resultant effect that forces people to make such decisions that would result in zero profits. In other terms, ancient theories of profit argued that profit resulted due to the fact that individuals never posses the perfect knowledge about the future (Rose, 2001).
In connection, product yields may end up being good or bad, customer tastes and preferences may become altered, while at the same time, new and unpredicted goods may come up (Swain, 1981). Such changes occur every time and every time they differ with individuals’ expectations, the revenues received from such goods and services will be higher than the costs of production; hence, result in profits. Similarly, profits will only be realized for the group of people that are willing to take up the risks of chance. In that sense, risk is a bold step that is taken where there is a significant level of uncertainty about the future, which may bring about both negative and positive values.
As established in several sources, risk can be seen in two different ways: This include the measurable uncertainty, as well as the immeasurable component that is not taken as uncertainty at all. In his definition, Rose (2001) asserts that risk is measurable, and in economic terms is not subject to the generation of profits. The author further asserts that risk can be quantified either on a priory ground or on the basis of empirical observation.
This fact allows people to make plans for protecting themselves against risk by changing it into certainty with an assumption that they such institutions can be created at will. Basing on various data about risk, it is much evident to mention that risk falls along the measurable component of uncertainty as this will aid people in establishing appropriate ways for preventing themselves against future risks (Bacon, 2001). In effect, this notion can be captured in the following paragraphs where the quantitative aspect of uncertainty has been employed in providing solutions for risk protection.
In a case, Mr. Slates Case, history had it that in any given number of years, 0.25 of the time quarries lose $1000; however, 0.75 of the time, they again make $1000 (Rose, 2001). With an assumption that that the investor individually owns a single quarry, it can be established that he has 75% chance of earning $1000, as well as 25% chance of losing $1000.
As such, it is possible to quantify the probability or likelihood of the upcoming future events; thus, the investor is facing risk (Anderson, Dillon & Hardakar, 1977). In the same way, several quarries within such an area that enjoy the 75-25% risk may group up together under some sort of agreement; hence, convert their collective risk into certainty. Rose (2001) asserts that the measurable component of uncertainty is where risk falls and gives the base for calculation of future risk facing an individual, business or organization.
As an example, if there are around 100 quarries within the above mentioned area with the one for Mr. Slate included, and all the quarries have the same 75%-255 risk, then the expected yearly earnings can be deduced easily (Rose, 2001; Mun, 2004). From the given data, the average or expected annual earnings for each of the quarries are deduced as [75%x$1000] + [25%x-1000] = $500; additionally, no individual quarry can make the loss of that magnitude. As such, each quarry will either gain $1000 or suffer a loss of $1000; however, no person can predict the ones to be victimized at the start of the year.
As a solution, the individual owners of the quarry might enter into a mutual agreement, which is designed at eliminating the risk created. The mutual agreement may require that all the individuals will pool their entire negative and positive benefits; thereafter, divide the outcome among them in an equal manner. For one particular year, it is expected that 75 quarries will gain money while 25 of them will make a loss; as such, the total earning for such a duration will be [75x$1000] + [25x-1000] = $50000. When this is divided among all the one hundred quarry owners, then the overall earnings for each of the quarries will be $500.
Quantitative Analysis and Forecast
Raw Data
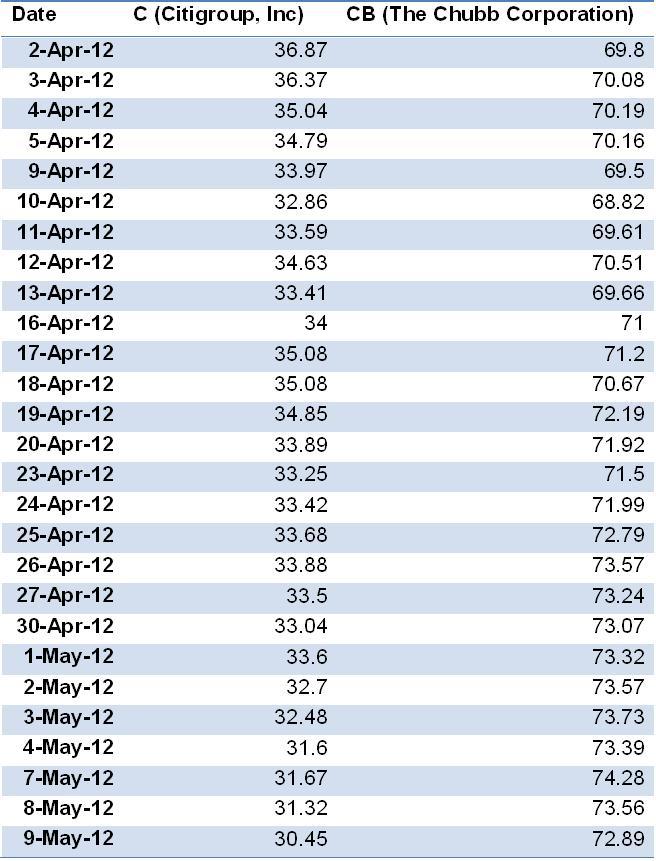
This quantitative analysis considers two companies that are listed in the stock market namely; Citigroup, Inc (C) and The Chubb Corporation (CB). The interest is in the correlation between the shares for the two corporations, listed as C and CB respectively. For the analysis, a monthly duration has been considered starting from second April, 2012 to ninth May, 2012 as shown in the following table.
Scatter diagram
From the raw data above, a scatterplot with CB share price on the x-axis (horizontal) and C share price on the y-axis has been generated as shown in the following diagram. In order to give clear information on the overall behavior of the scatter diagram, a trendline is included by selecting a linear-type regression (Graziano & Ravlin, 1993). As such, this results in the creation of a black line between the scatter points, which further displays the value of the line equation, as well as R-squared as captured on the diagram. These two values are the statistical indicators for the analysis and are extremely valuable in the process of analyzing the share prices.
Trend line and Regression Information
Testing for Correlation between the Data (C and CB)
In order to test whether there is correlation in the given information, a regression analysis is conducted and yields the following information. For the results, we have a summary output where the values for Multiple-R are given. In practice, Multiple-R is useful for various functions and is referred to as the expression of correlation, or the level of relationship existing between the established variables, CB share price and C share price. On the other hand, the value established for the R-square (co-eficient of determination) gives the same value as the one created from the trendline as seen on the graph. According to various sources, this is taken as the measure of ‘goodness of fit’, or how well the regression equation matches with the given information/data.
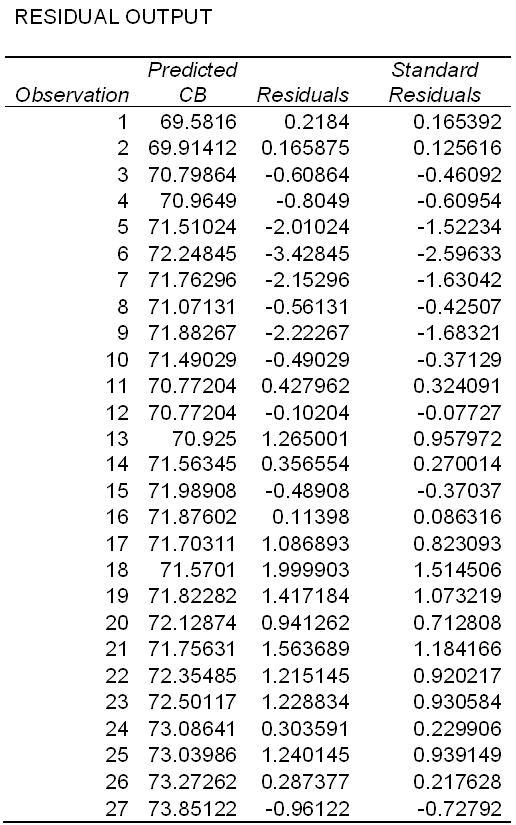
Regression analysis
As depicted in the summary output, this sample consists of 27 observations that are accounted for in the regression analysis. This data gives the frequency or the number of times the share prices for the two variables appear in the given data set over the selected period. As established by several reputed sources, Multiple-R measures whether there is an existing relationship between any pair of selected data for a particular analysis. In connection, the R-squared value is a measure of how well an identified equation describes the influence of an independent variable, as well as a dependant variable within a selected group of data. When the resultant value approaches -1, it depicts a strong negative correlation, 0 indicates that there is no correlation, while 1 indicates the existence of a strong positive correlation. From the results, therefore, it is evident that there is a medium positive correlation from the data set used in the analysis for C share price, as well as that for CB share price.
In connection, when a straight correlation test is conducted using the formula; =CORREL(B2:B28, C2:C28) an equivalent value (0.591541 to the Multiple-R value given above is derived. In that sense, there are values of the Multiple-R (correlation co-efficient), as well as R-squared (co-efficient of determination) that are established through different calculation methods.
As a conclusion, is important to mention that the R-squared value is a measure of how well an identified equation describes the influence of an independent variable, as well as a dependant variable within a selected group of data. When the resultant value approaches -1, it depicts a strong negative correlation, 0 indicates that there is no correlation, while 1 indicates the existence of a strong positive correlation. With a value lying between 0 – 6, it is realistic to mention that there is an average positive correlation between the data set used in the analysis for C share price and that for CB share price.
Qualitative Analysis
As established by several authors, qualitative analysis refers to any situation that does not depend on numerical analysis; hence, can be termed as non-numeric. In terms of risk, this is assumed to mean any risk that will not involve the use of numbers or probabilities for their determination. However, qualitative analysis can still be used in an effective manner during the identification of risk, as well as the prediction of the outcome; although, the process does not include the allocation of risk probability.
In line with that, it is evident that risk can be associated with change, which transforms into a lack of uniformity, stability, and predictability. Generally, qualitative forecasting approaches are employed during the initials stages of the product life cycle since; at the time, there exist minimal past information that could be utilized for quantitative forecasting approaches. There are several approaches that are used in qualitative forecasting some of them being the Delphi Technique, Nominal Group Technique (NGT), Market Research, as well as Sales Force Research among others.
From the above data on share price comparison, various qualitative methods can be employed in determining the share price forecasts, associated risks, as well as certainties (Makridakis, Wheelwright & Hyndman, 1998). The qualitative methods that are used will generate forecast values that will guide the direction of the organization’s operation. In this workplace situation, various qualitative forecasting methods can be used in establishing future share prices directions as captured in the following information.
The Delphi Technique
As several sources ascertain, the key purpose of the Delphi method is to achieve a consensus among a group of experts in relation to a particular uncertain matter. This method can be used in an effective manner especially in situations involving technical forecasting. With the help of expert opinions, the extent of surprise is reduced among the concerned individuals. This is generally a common occurrence especially in areas involving the development of a technology, financial impact of market, creation of new customer patterns, as well as political trends.
Similarly, the same effect can be achieved in market share prediction as announcements made by a particular body on experts tend to influence the mindset of several investors (Charry, 1997). As a result, a positive prediction may favor the trend of a particular share price in a positive manner, while a negative feedback may result in share value reduction. In the current situation, the required numbers for the share price prediction can be settled upon after a series of scrutinizes and agreement among the concerned group of experts.
Visionary Forecasts
Visionary forecasts are generally an appealing method that is not scientific, but is characterized by subjective guesswork and imagination. These processes normally consist of a number of predictions by different experts that are based on potential future occurrences. This method can play a crucial part in share price forecasts, as the targeted share prices may be influenced either positively or negatively depending on the forecast made. A group of upper-level managers undertakes the responsibility of developing forecasts in accordance with their knowledge of particular sections operation: This can be very helpful in determining the share prices of the two associated companies.
Focus Groups
In the same manner, focus groups may assist in the appropriate sharing of knowledge and information about certain events that may lead to a close guess or prediction to future values (Zack, 1993). As such, it is valuable to use such methods while planning to make crucial decisions for the success of the concerned parties. In conclusion, it can be said that qualitative methods are useful in the determination of appropriate solutions in business management despite the fact that numeric information may not be required in the situation.
Market Research
Additionally, market research may form a good basis for making forecasts of the share price values for C and CA respectively. This may be achieved by using shareholder surveys that are highly valuable when establishing potential demand for a particular stock. The qualitative method is administered developing questionnaires that are aimed at gathering personal, economic, demographic as well as marketing data, which are then used to make the final decisions (Zack, 1993). From the market research, a trend is established that is used in forecasting the approximate value of the share prices for each of the respective firms.
References
Almeder, R. (1998). Harmless Naturalism: The Limits of Science and the Nature of Philosophy. Chicago and La Salle: Open Court.
Anderson, J. R., Dillon, J. L., & Hardaker, J. B. (1977). Probability In Agricultural decision analysis. Ames: Iowa State University Press.
Bacon, F. (2001). Tools for Decision Analysis: Analysis of Risky Decisions. Web.
Charry, A. A. (1997). Conceptual mapping: An approximation to qualitative risk modeling. Orange: The University of Sydney.
Chisholm, R. (1989). Theory of Knowledge. Englewood Cliffs: Prentice Hall.
Davenport, T. & Prusak, L. (1998). Working Knowledge. Boston, MA: Havard Business School Press.
Graziano, A., & Ravlin, M. (1993). Statistical analysis of data In Research methods: A process of inquiry. New York, NY: Harper Collins.
Makridakis, S., Wheelwright, S. C., & Hyndman, R. J. (1998). Forecasting methods and Applications. USA: John Wily & Sons Inc.
Mun, J. (2004). Applied risk management: Moving beyond uncertainty in business. New Jersey: John Wiley & Sons.
Reany, P. (1988). What is Knowledge? Journal of Natural Philosophy, 2(1), 7-14.
Rose, M. (2001). Risk versus Uncertainty, or Mr. Slate versus Great-Aunt Matilda. Web.
Stirling, A. Ian, S. (2009). From Risk Assessment to Knowledge Mapping: Science, Precaution, and Participation in Disease Ecology. Resilience Alliance, 14(2), 14.
Swain, M. (1981). Reasons and Knowledge. Ithaca: Cornell University Press.
Williamson, T. (2000). Knowledge and its Limits. Oxford: Oxford University Press.
Zack, M. (1993). Interactivity and Communication Mode Choice In Ongoing Management Groups. Information Systems Research, 4(3), 207-239.
Zack, M. (1999). Managing Organizational Ignorance. Knowledge Directions, 1(1),36-49.