Introduction
Optimism is one of the psychological phenomena that has a significant impact on a person’s well-being. In its plain meaning, the concept refers to an individual’s state of being hopeful and confident about their future and success in doing something. Males and females face unique experiences that may determine their differences in optimism.
Social and economic factors have varying effects on the levels of optimism among females and males. Favorable economic, social, and cultural conditions are associated with optimism. The current study investigates whether there is a statistically significant difference in males’ and females’ optimism levels.
Quality well-being is anchored on a person’s positive attitude. Conversano et al. (2010) found that optimism facilitates adaptive and cognitive responses, promoting greater flexibility and problem-solving capacity. Boehm et al. (2018) investigated the correlation between optimism and healthier cardiovascular-related behaviors.
The researchers associated the concept with three health behaviors related to preventing cardiovascular diseases: diet, cigarette smoking, and physical activity. The study showed optimistic individuals were less susceptible to cardiovascular diseases than pessimistic ones (Boehm et al., 2018). Therefore, being optimistic is significant for quality mental and physical wellness.
While optimism positively affects people’s health, determining the level of differences between males and females can be important. Sheehy (2011) argues that midlife women flourish more than men. Research by Gallup-Healthways shows that 25% of women ages 45 to 55 give themselves a 10 out of 10 on optimism about their future (Sheehy, 2011).
The good attitude among women has enabled them to develop an urge to learn new things that benefit them. Additionally, Sheehy (2011) confirms that higher positive levels among females than males are associated with girlfriend circles. An in-depth understanding of the differences in optimism levels between men and women is crucial.
Methodology
Participants
Data for the current study were collected from thirty participants. Eighteen of the thirty participants were ages 21-30, while the rest were above 41. The age differences between the participants were vital since they could reflect on how optimism shaped their past decisions and eventual consequences. Another substantial demographic information about the respondents was their economic status and education level. The demographic characteristics of the respondents were crucial in relating the current study results to the existing ones on the concept of optimism.
Materials
Practical data collection tools are essential for gathering reliable and accurate responses. A closed-ended questionnaire was used to collect data from the thirty participants. Using the material made it easier for the respondents to answer the questions since they had a choice of only selecting one answer for each item asked (Diez et al., 2022).
Another advantage of the closed-ended questionnaire was the ease of obtaining measurable data (Hughes et al., 2022). The questionnaire had a total of six items associated with optimism. Each item was measured on a Likert scale ranging from 1, “strongly disagree”, to 5, “strongly agree”. Therefore, the high total scores showed high levels of optimism for the participants.
Procedure
Data collection was done online, considering the high number of participants and the limited time required to conduct the survey. In finding the participants, invitation messages were sent to the WhatsApp groups and emails of targeted individuals. The targeted groups were those of people in the working classes with high levels of education. Those who replied were briefed on the study’s aims and objectives. After that, the questionnaires were sent to the consented participants, who were expected to send completely filled-in questionnaires within 24 hours.
Results
Sum for Each Person
Tables 1.0 and 2.0 (Appendix) show the total sum for each participant participating in the study. The total sum indicates the “optimism” level score, with the highest possible being 30. While Table 1.0 shows the scores for females, Table 2.0 shows the scores for males. From the table, the most optimistic person scored 27, while the least optimistic person scored 19.
Mean, Median, Mode, and Standard Deviation
The descriptive statistics, mean, mode, median, and standard deviation helped understand the differences in scores between males and females. Tables 3.0 and 4.0 (Appendix) show the descriptive statistics of females and males, respectively. The mean, mode, and median for females are 22.67, 23, and 23. Meanwhile, the males’ mean, mode, and median are 22.7, 23, and 23.
Distribution Nature
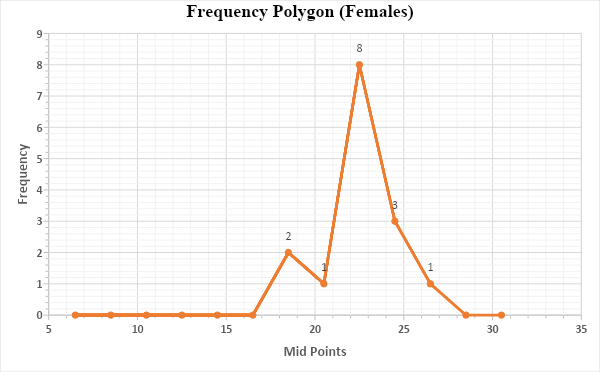
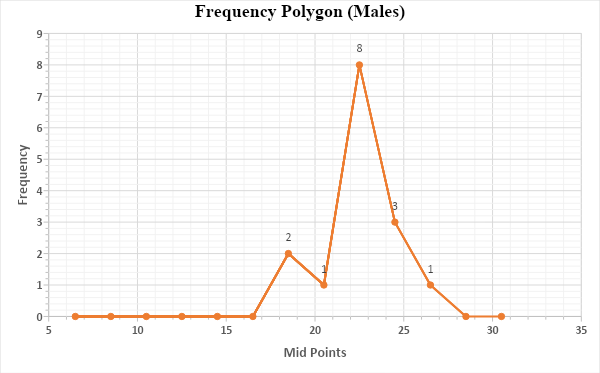
The mean, median, and mode of both females’ and males’ data are close to or exactly 23. Therefore, the distribution is normal since the descriptive statistics are almost identical. Graphs 1.0 and 2.0 (Appendix) show the distribution polygons for females and males, respectively.
Both graphs, males and females, seem symmetrical, making them approximately normal (Diez et al., 2022). Furthermore, a keen look at the raw data in Tables 1.0 and 2.0 shows that the distribution is normal since more people tend to have a sum of 23 than those whose sum is farther from 23, which is the mode for both genders. The scores could be changed to yield a skewed distribution by having more people have greater scores for each question and only a few with lesser scores.
p-Value
The study aimed to investigate whether there is a significant gap between male and female “optimism scores”. The calculated t-test shows a value greater than the significance level of p=0.05. Therefore, there was no significant difference between the optimism levels among males and females.
Conclusion
Optimism is an essential psychological aspect crucial to people’s quality of life. Optimistic individuals are believed to see opportunities in the difficulties they face compared to those who are pessimistic. Consequently, it is easier for a person with a positive attitude to take part in a challenging task than one with a negative attitude. For instance, avoiding unhealthy behaviors such as smoking cigarettes and drinking alcohol takes courage and effort since they are addictive.
Adopting activities that promote optimism among individuals can be a great way to promote quality of life. Individuals with health problems, including obesity and cardiovascular diseases, can be encouraged to participate in activities that give them a positive attitude about their present and future lives. Therefore, optimistic people have higher quality psychological and physical wellness than pessimists.
While there is a significant difference in terms of health between optimistic individuals and those who are pessimistic, the effect remains the same for both genders. The current study observed the optimism scores among males and females of an equal population. The study recorded some significant findings on the subject matter.
The “optimism scores” distribution for males and females was normal. The descriptive data showed that both genders had an average, median, and modal score of 23. Similarly, the used polygons were symmetrical, indicating a normal distribution of the same (Diez et al., 2022).
Additionally, although males and females were approximated to have equal optimistic levels, the former had a slightly higher average than the latter. Consequently, men are slightly more optimistic than women, and a cause for that can be determined in future studies. Thirdly, the findings showed that the optimism levels of males and females had no significant differences. Encouraging optimism will yield similar results for both genders.
References
Boehm, J. K., Chen, Y., Koga, H., Mathur, M. B., Vie, L. L., & Kubzansky, L. D. (2018). Is optimism associated with healthier cardiovascular-related behaviour? Circulation Research, 122(8), 1119–1134. Web.
Conversano, C., Rotondo, A., Lensi, E., Della Vista, O., Arpone, F., & Reda, M. A. (2010). Optimism and its impact on mental and physical well-being. Clinical Practice & Epidemiology in Mental Health, 6(1), 25–29. Web.
Diez, D., Cetinkaya-Rundel, M., & Barr, C. D. (2022). Open intro statistics (4th ed.). Creative Commons.
Hughes, J. L., Camden, A. A., Yangchen, T., Smith, G. P. A., Domenech Rodríguez, M. M., Rouse, S. V., McDonald, C. P., & Lopez, S. (2022). Invited editorial: Guidance for researchers when using inclusive demographic questions for surveys: Improved and updated questions. Psi Chi Journal of Psychological Research, 27(4), 232–255. Web.
Sheehy, G. (2011). Girlfriends are key to women’s optimism. USA Today.
Appendix
Table 1.0: Optimism scores for females
Table 2.0: Optimism scores for males
Table 3.0: Females’ descriptive statistics
Table 4.0: Males’ descriptive statistics