Abstract
This is a study to understand the effect of various hormones on the regulation of blood Glucose in sheep. The researcher has used hormones such as Glucagon, saline, Dexamethasone and Adrenaline in sheep. The result is given in the table and it is talked about in the discussion part of the report. The change in the glucose level and insulin in the body due to these hormones are measured by the researcher and it is found that the hormones greatly influence the blood glucose level and insulin in the body.
Introduction
The Endocrine System regulates the Glucose levels in the blood. The incidence of Type II diabetes mellitus and obesity is rapidly increasing throughout the world; particularly in developed countries. This is due to the over use of food; particularly highly palatable processed foods with high GL indices and fat content. Therefore, a thorough understanding and study is necessary to assess the Glucose metabolism to develop new strategies to deal with these diseases. This report presents the result of the study about the effect of various hormones on the regulation of blood Glucose in sheep. Glucagon, Saline, Dexamethasone and Adrenaline are hormones which are administered in the sheep. All these hormones affect the level of Glucose in body and over production of these hormones would be one of the risk factors for the diseases. “Glucagon increases blood Glucose concentration” (Glucagon for injection, 2005, p.1). “Adrenaline increases the strength and rate of the heartbeat and raises the blood pressure.” (Function of adrenaline hormone, 2010, para.3). “The increases in blood flow arterial and venous blood Glucose and (A-V) Glucose following adrenaline injection observed in this study” (Alada, Fagbohun & Oyebola 2001, p.4). “A saline solution, especially one that is isotonic with blood and is used in medicine and surgery” (Glossary of dog terms, n.d., para.6). “Dexamethasone is a steroid drug. It is similar to cortisone, which is made in the adrenal glands. The drug has anti-inflammatory effects in the body which is the desired action” (Decadron, (2008, para.2).
Materials and methods
Various materials used in this study are 2 x 10 ml syringes, 50 ml of heparinised saline, 10 x heparinised blood tubes and Practical Manual 2010 PSIO 331 Advanced Physiology I 9. The method used in this research is the experimental method. The researcher made experiment with eight sheep to assess effects of various hormones in them. The researcher has incorporated graphs and tables into this paper to provide a lucid understanding about the result of the study. The statistical method used in the study is calculating the ‘mean’ from the data observed due to the change in the glucose. The researcher measured the changes in time observed in the sheep. It is found that the glucose and insulin in the body is greatly influenced by the hormones. The procedure used in this project is “Standard Curve that uses glass dilution tubes, serially dilute bovine insulin standard (5mIU/mL) by halves using charcoal stripped horse plasma (CSHS) as diluents and glass dilution tubes. In duplicate, transfer 100 μL of each dilution into plastic (4mL) assay tubes. Quality Control: Using glass dilution tubes, serially dilute Quality Control plasma by halves using CSHS as diluent. In duplicate, transfer 100 μl of each dilution into plastic (4mL) assay tubes. Assay Controls: In duplicate, label plastic (4mL) assay tubes: TC (Total Count) x 2 tubes NSB (Non Specific Binding) x 2 tubes B0 (B zero) x 2 tubes. Add 100 μL CSHS to NSB and B0 tubes only. Samples: In duplicated, add 100 μL of sample or sample dilution (diluent CSHS) to plastic (4mL) assay tubes. Primary (1o) Antibody Addition: Add 100 μL of anti-bovine insulin antibody (1:8,000 – 1:12,000 in RIA buffer) to each 4mL assay tube (EXCEPT NSB and TC assay tubes). Add 100 μL of Antibody diluent only to NSB assay tubes and Tracer Addition: Calculate volume of tracer required for 100 μL / tube and the volume of stock tracer required for a final count of ~20K/100 μL, with an additional ~600 μL to allow for pipette dead space. Check the cpm of this final mix and adjust if necessary. (Using protocol rack 13 and the gamma counter in radiation room). Add 100 μL of tracer to each 4mL assay tube.” Practical Manual 2010, PSIO 331 Advanced Physics given by the costumer.
Results
Discussion
Many things are unfolded in this study to understand the effect of hormones in the regulation of blood Glucose in sheep. Here, eight sheep are experimented to determine the effect of hormones. The sheep were given numbers such as 6309, 6062, 6003, 6039, 6033, 6027, 6037 and 6067 to identity them. They were injected the hormones like Adrenaline, Dexamethasone, Glucagon and Saline. The table shows that the sheep 6062 which was injected by Adrenaline and Dexamethasone showed the effect of 55 Glucose mM/L. This is the highest rate of Glucose in the table and the table has given the level of Glucose in each sheep. 6039 was given Adrenaline only and its Glucose level is reported as 6. When it was provided with Adrenaline and Dexmethasone; the Glucose level was found to be 55. 6003 was treatment with Dexmethasone and Glucagon made the Glucose level to 43.5. 6039 was given three hormones, Adrenaline, Dexamethasone and Glucagon and it was reported to be 46.5. The fifth sheep was given Saline only and it was recorded with a Glucose content of 49. 6027 was given adrenaline and Glucagon which resulted in the level 49.5. Then, 6037 was provided with Glucagon which is the second rate in the table; recorded as 54. Then the last sheep was given Dexamethasone only and it is reported 49.5.
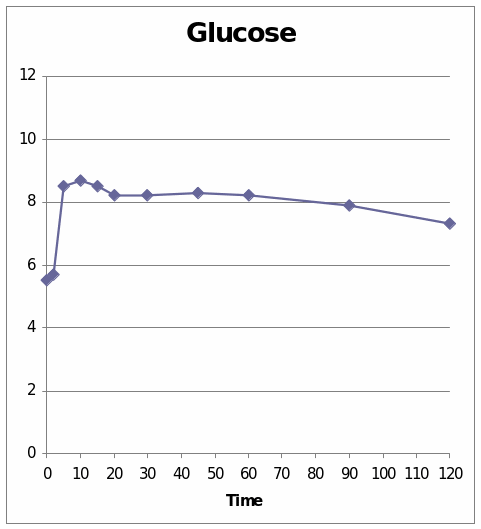
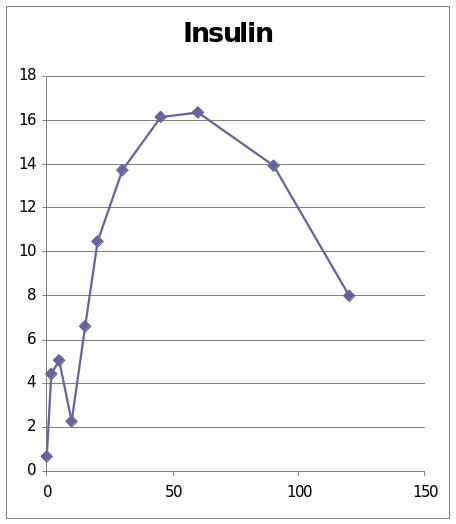
From these two graphs we understand the effect of the Adrenaline hormone in the 6309 sheep. It is observed that the graph which has presented the change of glucose level shows that it went to the peek in the beginning and then is shows a diminishing stage. In the second graph which presents the change due to the insulin shows that it line is at peak at the centre. The change occurs shortly and then it went peak and at last the change reduces.
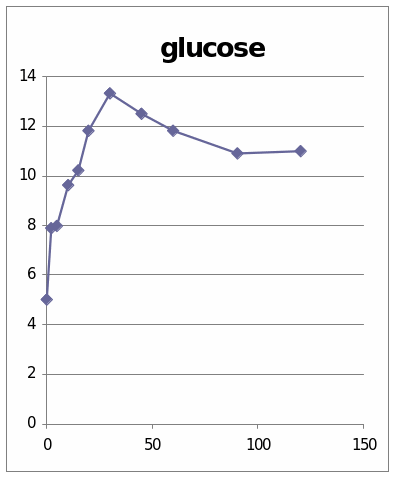
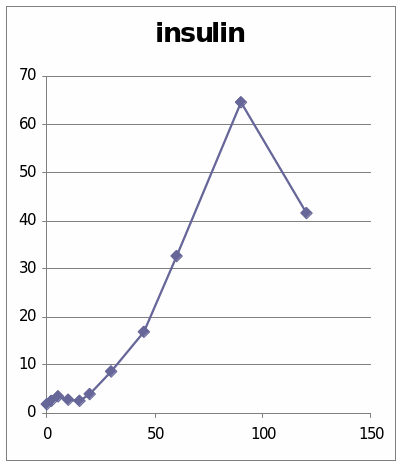
The table and graphs show the effect of adrenaline, Dexamethaline and Glucagon in the sheep 6309. The first graph presents that it went to the top and it reached 12.5 and then it starts to diminish. The second graph shows the effect of insulin in the sheep. It went to the peak and reached 64.522. then it starts to diminish.
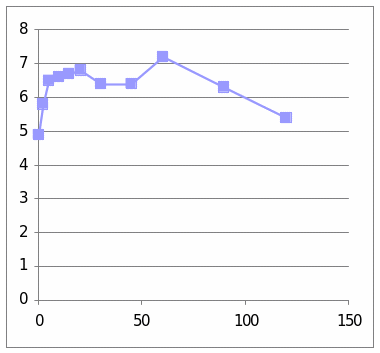
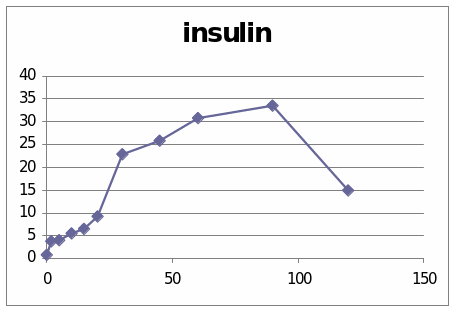
From these two graphs we understand the effect of the Adrenaline and dexamethaline hormone in the 6062 sheep. It is observed that the graph which has presented the change of glucose level shows that it went to the peek in the centre and then is shows a diminishing stage. In the second graph which presents the change due to the insulin shows that it line is at peak at the centre.
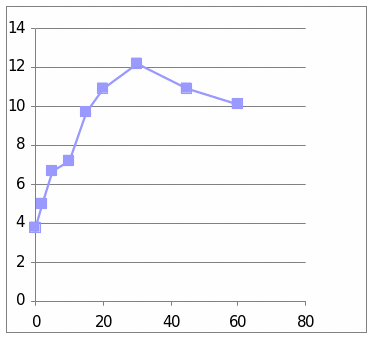
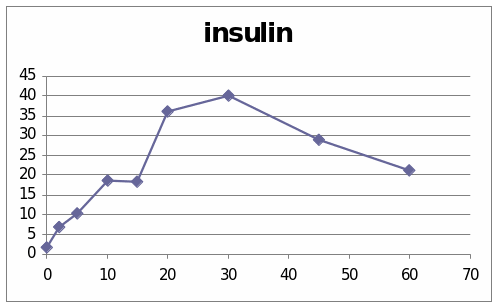
From these two graphs we understand the effect of the Dexamethaline and glucagon hormone in the 6003 sheep. It is observed that the graph which has presented the change of glucose level shows that it went to the peek in the beginning and then is shows a diminishing stage. In the second graph which presents the change due to the insulin shows that it line is at peak at the centre. The change occurs shortly and then it went peak and at last the change reduces.
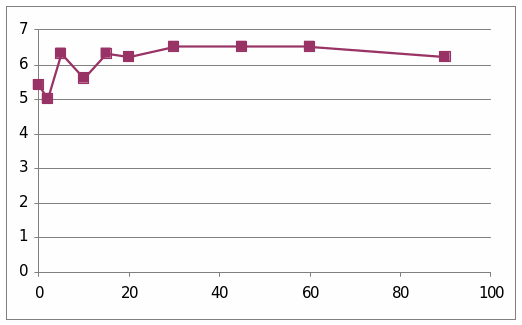
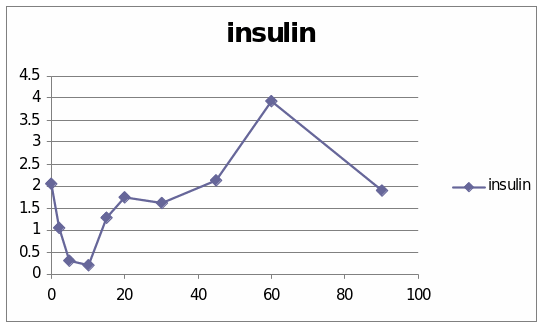
The table and graphs show the effect of adrenaline, Dexamethaline and Glucagon in the sheep 6033. The first graph presents that it went to the top and it reached 6.5 and then it starts to diminish. The second graph shows the effect of insulin in the sheep. It went to the peak and reached 4. Then it starts to diminish.
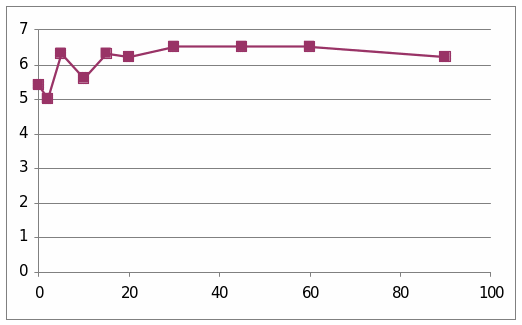
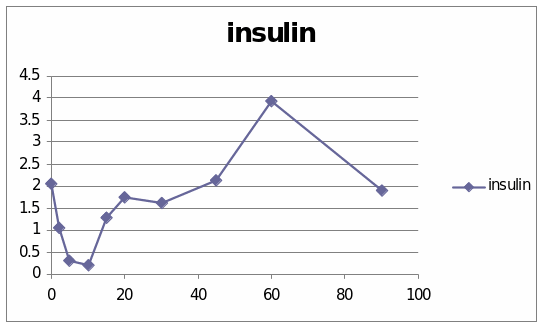
From these two graphs we understand the effect of the Adrenaline and glucagon hormone in the 6027 sheep. It is observed that the graph which has presented the change of glucose level shows that it went to the peek and then it goes in a parallel way. In the second graph which presents the change due to the insulin shows that it line is at peak at the centre and then it is diminished.
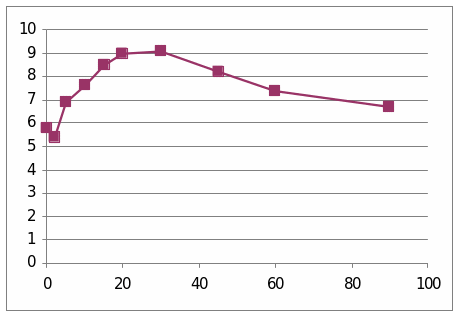
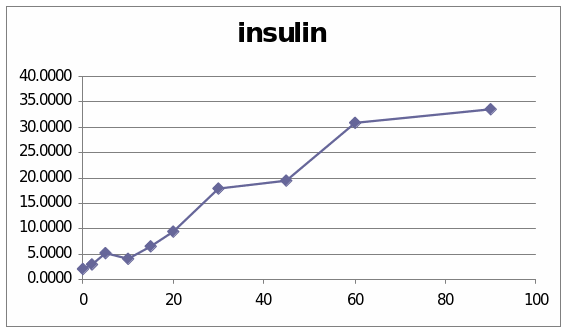
From these two graphs we understand the effect of the Adrenaline and glucagon hormone in the sheep. It is observed that the graph which has presented the change of glucose level shows that it went to the peek slowly and then it does not show a diminishing stage. In the second graph which presents the change due to the insulin shows that it line increases and at last it come to the peak.
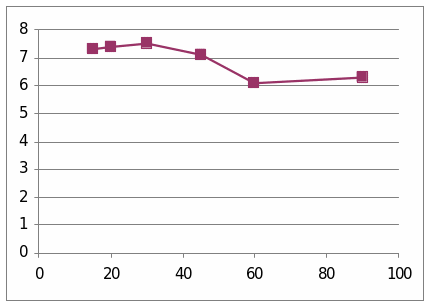
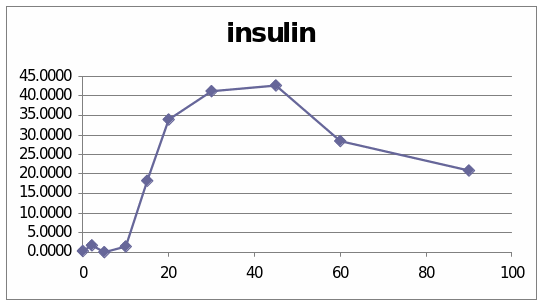
The table and graphs show the effect of Glucagon in the sheep 6037. The first graph presents that it went to the top at the beginning and then started to diminish slowly. The second graph shows the effect of insulin in the sheep. It went to the peak at the centre and then started to come down.
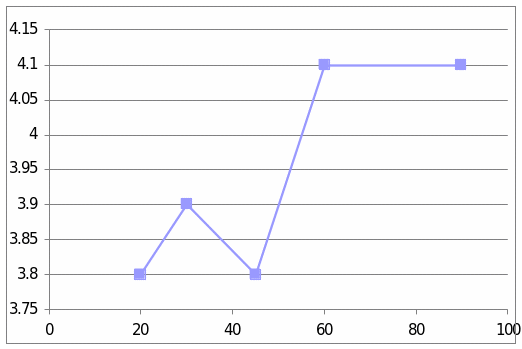
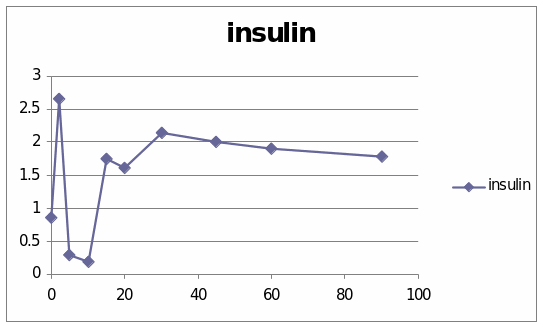
The table and graphs show the effect of Dexamethaline only in the sheep 6067. The first graph presents that it went to the top and then suddenly diminished and it reached 4.1. The second graph shows the effect of insulin in the sheep. It went to the peak in the beginning and then it was diminished finally it again went top and stated to diminish slowly.
Conclusion
It is the need of the time to assess the effect of various hormones on the regulation of blood Glucose in humans since it would lead to the prevention of many of diseases. The researcher has used hormones such as Glucagon, saline, Dexamethasone and Adrenaline in sheep so as to understand the varying effect in other beings. The tables and graphs give explain the changes observed by the researcher.
Reference List
Alada, A. R. A., Fagbohun, T. D., & Oyebola, D. D. O. (2001). Affect of adrenaline on glucose uptake by the canine large bowel. African Journal of Biomedical Research, Web.
Decadron, (2008). [Online] Jackson Siegelbaum. Web.
Function of adrenaline hormone. (2010). Hubpages. Web.
Glossary of dog terms, (n.d.). Best Friends. Web.
Glucagon for injection. (2005). Eli Lilly and Company. Web.