Introduction
Creating the environment, in which consistent quality improvement becomes a possibility, is imperative for the contemporary entrepreneurship. Therefore, a detailed analysis of the current production process, including the repeatability and the reproducibility levels needs to be carried out (Liu, 2014). In the context of the identified scenario, one will have to carry out a one-sample t-test to figure out whether the average number of defects produced is likely to be less than seven items per week.
Methodology
One Sample T-test
To carry out the calculations and determine whether the number of defects produced per week is less than seven, one will have to use a one-sample t-test (Hieman, 2014). The reasons for choosing the test are rather basic; by definition, the one-sample t-test helps determine whether the sample mean is any different from the population mean (Elliot & Woodward, 2015). Therefore, the identified approach helps prove the null hypothesis either right or wrong.
Null Hypothesis
The number of defective drivers produced by the company is equal to or more than seven (i.e., there is no difference between the population mean and the sample mean).
Alternative Hypothesis
The number of defective drivers produced per week by the company is less than seven (i.e., the difference between the population mean and the sample mean is rather tangible).
Analysis
Test Statistic Value
To conduct the one-sample t-test, the GraphPad online software was used (GraphPad Software, 2016). The confidence interval was set at 0.95; for the identified difference, the confidence interval ranges from -0.48074857918 to 0.54741524518 (approximating the above data, one will retrieve the following results: from -0.48 to 0.55).
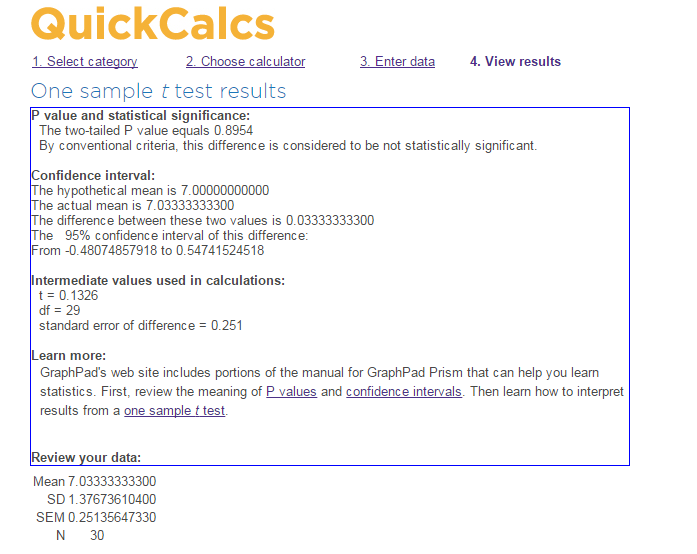
The standard error of difference equals 0.251 in the identified case, which means that the sample may deviate from the stated mean within the range mentioned above.
P-Value
According to the outcomes of the test, the P-value is 0.8954.
Decision
Seeing that the p-value is 0.8954 in the identified scenario, rejecting the null hypothesis is impossible (Elliot & Woodward, 2015). Therefore, the null hypothesis can be considered confirmed. In other words, the number of defects produced by the company is equal to or more than seven. The identified outcome can be deemed as the impetus for making a change in the current approach toward quality management (Gintzer, 2013).
Thus, based on the outcomes of the test, one may conclude that the number of defects currently produced by the company is at the very least equal to seven. More importantly, the number in question may be more than seven on a range of occasions as the test outcomes show. Indeed, seeing that the null hypothesis has been confirmed, it will be reasonable to claim that the company should use a more efficient quality management approach (Kiritharan, 2013).
Conclusion
Carrying out a one-sample t-test was enough to prove that the statement made by the operations manager is false. In other words, there is a strong probability that the number of defective items produced by the company regularly is more than seven or equal to seven on average. The application of a one-sample t-test serves as a substantial method of determining the probability of the null hypothesis. As a result, the precision of a forecast made based on the statistical analysis becomes very high.
Reference List
Elliot, A. C., & Woodward, W. A. (2015). SAS essentials: Mastering SAS for data analytics. New York, NY: John Wiley & Sons.
Gintzer, G. (2013). Positive quality management for a change: A motivating report about practical experiences in designing and implementing a (quality) management system. Berlin: Books on Demand.
GraphPad Software. (2016). One sample t test. Web.
Hieman, G. (2014). Behavioral sciences STAT. Boston, MA: Cengage Learning.
Kiritharan, G. (2013). Total Quality Management – a system to implement. New York, NY: Lulu.com.
Liu, P. S. (2014). Hepatobiliary imaging, an issue of magnetic resonance imaging Clinics of North America. New York, NY: Elsevier Health Sciences.