Project Description
The project is focused on process and operations improvements at Kaiser Permanente. The project will take four weeks to complete, and the project will require $10300 to accomplish, including analytical instruments, analytical work, and organizational endeavors. In the case of the project scope, it aims to apply the core principles of lean management and statistical process control methods to Kaiser Permanente. The project objectives will be achieved by conducting a comprehensive statistical assessment and analysis of the company’s operations and processes. The project will be primarily conducted by a project manager, and data collection will take place with the help of the company workers. And thus, it is part of their responsibilities.
Justification for Lean Management
It should be noted that Kaiser Permanente is a healthcare organization, and the current literature supports the framework of lean healthcare management and service delivery. For example, it is stated that lean healthcare can improve the effectiveness and efficiency of operations (Hallam & Contreras, 2018). However, the integration of such a system is mostly localized with no organization-wide use. Therefore, the utilization of clearly defined protocols is of paramount importance for ensuring the correct application of lean management principles.
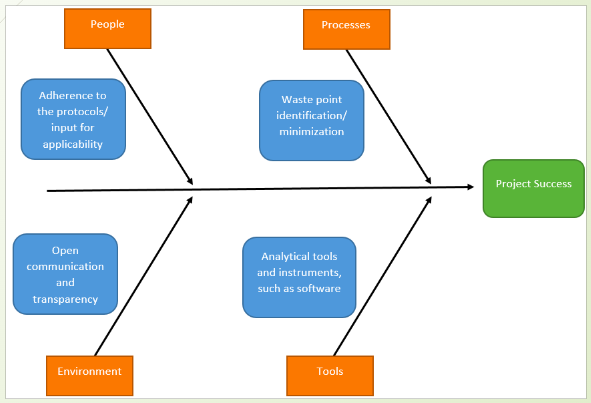
Project Management Charts: Fishbone

The control chart is a graph-based illustration of the previously presented data, where occurrence deviations and inconsistencies are not in the alignment of the protocol values, which are close to average estimates. Although the occurrence line does not exceed the upper critical limit, the peak demonstrates the need for adjustments and modifications due to significant operational fluctuations.
The core principles on which the project will be conducted are lean management as well as statistical process control methods. The presented table is data, which gives a justification for the project realization since the values are indicative of operational inconsistencies and inefficiencies. The table is an evaluation control table with columns representing Sample IDs, occurrence numbers, average values, upper control limits, and lower control limits from left to right, respectively. The data in the table demonstrates critical process values, which show the precise variations in comparison with means as well as UCL and LCL. The process sampling is significant to ensure a proper application of waste identification and subsequent reduction.
Improved Process Flowchart

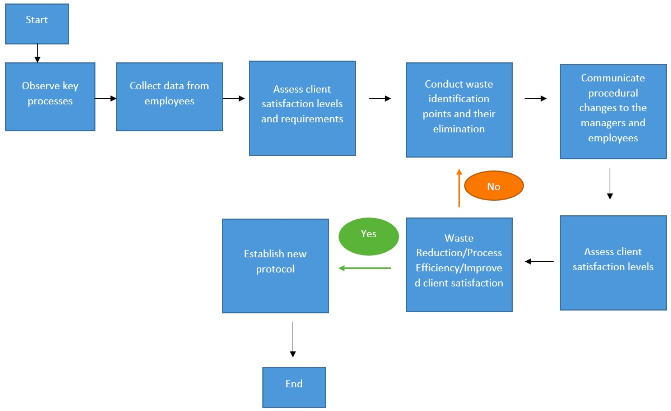
The improved process flowchart is designed to generate a reciprocal loop in order to ensure that improvements take place after each procedural modification. In other words, the project does not solely focus on waste elimination, which is why a two-factor analysis is incorporated. The baseline is set by client satisfaction levels with the services provided by the company, and the waste elimination changes should not decrease the baseline level. If a modification increases process efficiency with a reduction in client satisfaction, the flowchart will conduct another loop to maintain or increase the baseline factor.
Meeting Cadence/Rhythm and Timing
Since the project is estimated to take four weeks, there will be three categories of meetings. Two monthly meetings will take place at the beginning and end of the month. The first monthly meeting will be an introductory session, where the core framework and methodology of the project will be presented to the involved parties. The final monthly meeting will establish and announce a newly improved protocol for the employees with the approval of managers. Weekly meetings will take place each Friday, and both managers and employees will be required to attend them. The goal is to address and assess the overall progress done throughout the entire week. Lastly, the daily meetings will take place on an individual basis in order to ensure the adherence of employees to the modifications.
Metrics to Measure the Project’s Success
It is important to note that the first and the core metric for the project’s success measurement is client satisfaction since the given metric must not decrease and remain at least static as other efficiency-improving changes are taking place. The second metric is waste reduction, and the waste is time and resources spent unnecessarily with no significant impact on service delivery and client satisfaction. The third metric is adherence to the established protocols with changes, where the adherence to the proposed changes by employees is a sign of applicability and plausibility of the alterations and modifications.
Financial and Budgetary Considerations
The project will require $10300 in total, and the majority of resources will be allocated to the analytical work performed by the project managers, which is equal to $8000. The acquisition of analytical software and other instruments of assessment is equal to $1000, and the organizational activities, such as meet-ups and staff meetings, will require small budgetary allocations, which are equal to $500. In addition, communication and data collection tools will need $300, and transportation and client assessments will require $500.
Description of the Project Reporting Structure

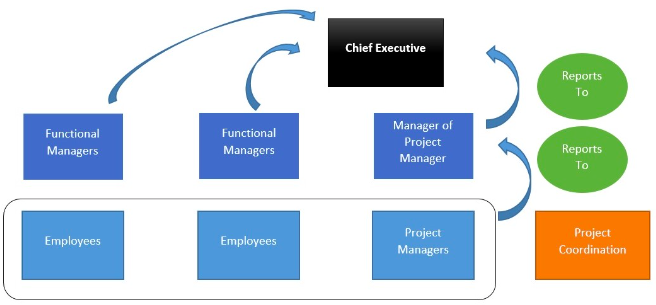
The reporting framework will adhere to the standard procedural steps, where the project coordination and execution will be conducted mainly by project managers and employees. Project managers will be mandated to report to the Manager of Project Managers or chief project manager, who finally reports to the chief executive of the company. In addition, functional managers overseeing the employees will also report on the impact of the project on the workers in order to paint a clearer picture of the progress and changes for the chief executive.
Conclusion
In conclusion, the project will implement core lean management practices into Kaiser Permanente’s operations with the use of statistical process control methods. The baseline metric will be client satisfaction levels since the waste reduction improvements must not decrease the former metric. The flowchart will be based on a reciprocal loop, which will ensure a gradual efficiency improvement. The meetings will be conducted daily, weekly, and twice a month in order to track progress, receive feedback, and announce new recommendations.
Reference
Hallam, C. R. A., & Contreras, C. (2018). Lean healthcare: Scale, scope and sustainability. International Journal of Health Care Quality Assurance, 31(7), 684-696. Web.