Analysis of Kodak’s Situation Using the 3S model
Theory
Companies require a consistent theoretical and practical approach to maintain their competitive advantage. A channel of access, sharing, and integrating knowledge is important in every organization aspiring for innovation. In a disruptive business market, organization need a strategy-making process which enables it to go beyond their capabilities and that creates new market positions (Kodama 2018, p. 10). The current discussion proposes a strategic Community-based Firm Framework to help Kodak succeed in its strategic and structural reforms. The framework acknowledges and integrates new knowledge from the immediate community to create a dynamic strategy in the changing business environments and help respond to external changes (Kodama 2018, p. 2). Form the knowledge-based view of organizations, corporations can acquire knowledge as asset in establishing their target market position. By creating knowledge networks and communities, an organization can keep track of the environmental changes and specific consumer needs. The framework proposes that organizations can create Strategic Communities (SCs) and establish their target position. The value-based marketing is also an aspect of the approach since the SCs help the organization in keeping track with new trends, innovation, and product qualities. As a result, the framework enables organizations to identify its market position within its SCs. The 3S model will divide Kodak’s organization into 3 major levels, strategic, systematic, and situational, to diagnose and prescribe a solution to the economic problem that it faces.
Application to Kodak
Strategic
At the strategic level, Kodak requires a competitive technological innovation in digital photography to compete in the industry. Essentially, the organization ought to apply the knowledge-based view of its business environment to create new target market positions (Kodama 2018, p. 10). The strategy implies that companies in the photography industry should constantly update their technological capabilities to keep up with the new changes (Kodama 2018, p. 25). Comparing the approaches between Fujifilm and Kodak in traversing the disruptive digital industry can help draw many lessons. Fujifilm opted for technological capability reforms while Kodak decided to defend its capabilities. The strategic community-based firm concept would help Kodak create an SC that values its new products and channels its marketing strategies. The approach is akin to market segmentation but also incorporates value-based pricing. Kodak can then apply the current trends in photography after identifying its SCs.
Specifically, Kodak should consider adopting cell production methods, large-scale integrated (LSI) development, and improving the system. Computational photography is a current trend in digital photography which is likely to disrupt the industry without clear strategies. Social and representational functions of photographic imaging may face disruption following the wide use of computational photography (Taffel 2020, 237). The trend involves the use of automated compositing, automated facial retouching, alternative frames within the image, and simulation of depth-of-field (Taffel 2020, 237). Photography companies should integrate such new knowledge into their decision-making for continuous innovation. Kodak should acquire knowledge from its immediate community and accommodate change in the algorithmic and automation processing to keep in touch of the current situation.
From the study carried out by the then Kodak’s CEO Barabba, digital photography had the potential of replacing Kodak’s film photography. The first and major milestone of Kodak was the innovation of a megapixel camera as a strategy to support rather than replace film photography. Kodak requires a generic business-level strategy to innovate new products to attract customers. The differentiation strategy ought to incline digital photography to help diversify its innovation capabilities into new fields that consumers value (Ho and Chen 2018, p. 355). However, the organization failed to penetrate the digital photography market due to the strict timeline.
Systematic
The systematic level analysis of Kodak’s response to the digital disruption denotes that Kodak erred in its response to the digital disruption. First, an organization should not abandon a competence disrupted in their home market (Ho and Chen 2018, p. 352,). Secondly, a disruptive technological change does not often outlaw an organization’s product qualities (Ho and Chen 2018, p. 354). As a result, the firm needs to assess its technological system and identify areas of improvement in terms of digital innovation. The systematic approach should traverse the strategic management of the organization. The approaches would help Kodak restructure its business operations and reintroduce its products to the consumer market. Essentially, the organization should delve into inept technological systems in its operations. In the case of Fujifilm and Kodak, the two organizations differed in terms of strategies, especially regarding structural reforms. Kodak, on the other hand, defended its capabilities. Kodak needs to employ complete structural reforms and extend new capabilities for transformation.
The strategic community-based framework will help Kodak succeed in its structural reforms using the knowledge-based approach. The framework integrates new knowledge from the organizations, groups, and individuals within and outside the firm to create dynamic structural changes in the changing business environments (Kodama 2018, p. 2). The knowledge within and outside of an organization is valuable in marketing and launching new IT-based ventures (Kodama 2018, p. 10). Again, the approach is a type of personalization in which the structural and technological reforms would be consumer-based. Kodak enjoyed the support from its home market, which is major leverage in the structural change. The SCs will help drive the organization’s innovations and provide a market for the products.
Situational
The situation of Kodak is of economic desperation whereby the organization views digital photography as an enemy of the chemical-based film instead of an opportunity. One can argue that Kodak ought to compete with digital photography firms from the inside and not outside, which is accurate. From the Community-based firm framework, it is evident that the organization ignored the dynamic knowledge of its immediate community. Kodak’s case shows that an organization may suffer the detriments of changing the external environment when they ignore the knowledge-based view.
Initially, Kodak insisted on its technological capabilities and was adamant about incorporating digital technological reforms. Kodak represents a stagnated organization in terms of innovation and management. The Advantix, for example, had the digital camera qualities, yet Kodak failed to fully incorporate the transition because it insisted on photo film. Kodak required critical decision-making to transition from photo film to digital photography (Karami 2019, n.p). The current situation does not require value addition to Kodak’s products but a complete overhaul of the system and replacement with a digital technological system. The community-based firm framework will help Kodak respond to consumer needs in the current situation by upgrading its process and technological capabilities (Kodama 2018, p. 25). Again, the current situation requires consumer-driven production, marketing, and pricing of Kodak’s products. The organization should not major in cutting costs but create strategic communities in their niche to enhance competitive advantage.
Hospital Service Blueprint
The points shaded in yellow represent the major contact points with patients.
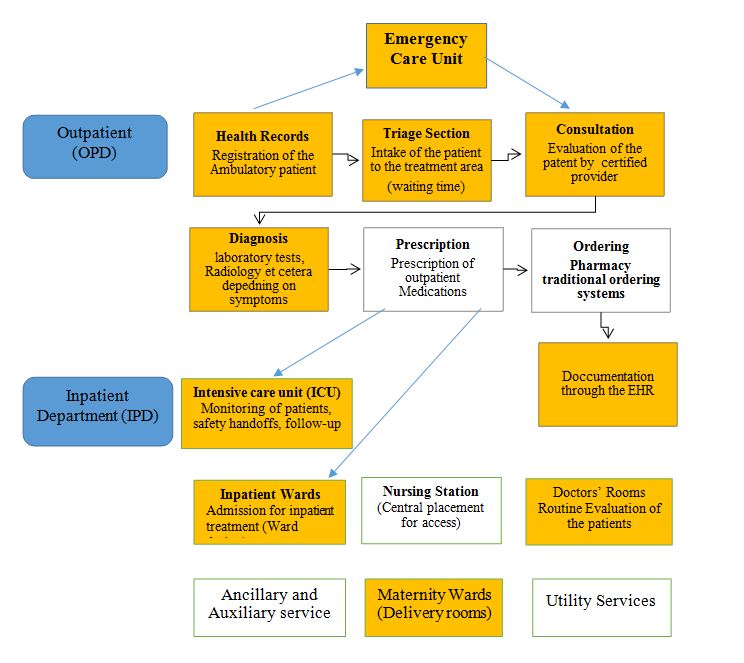
Contact Areas
The major contacts areas are the triage section, which is highly important during analyzing hospital service blueprint. Emergency unit, consultation rooms, Laboratory and other diagnostic areas, inpatient wards, and Intensive care units are the foundation of this structure (Figure 1). Major operations that may contribute to slow workflow include documentation, Ordering, Prescription and administration, nursing routine rounding, referrals, and handoffs (Beltrán Guzmán, 2019, n.p.). The hospital is most likely using the traditional manual workflow. For example, in the Emergency Department (ED), arrival and treatment delays are likely to occur when the department depends solely on ambulatory patients’ arrival (Schröder et al., 2019, p. 4). An Emergency Medical Services (EMS) system would fill the gap by diversifying the levels of contact with the patient from the scene, with paramedics, and at the hospital (Schröder et al., 2019, p. 4). In the IPD, the major concern for slow service delivery could be the ward design, facilities, equipment, and medications. Insufficient resources in the IDP are likely to cause slow service delivery. The aftermath of inefficient processes is overcrowding, leading to burnout, medical errors, patient frustration, and negative patient outcomes (Beltrán Guzmán et al. 2019, n.p). Thus, manual documentation and ordering systems are the leading causes of in-hospital inefficiency workflow.
Action Plan
Hiring of staff and outsourcing of equipment is the first action plan. The hospital has large capacity with limited staff and equipment which causes delays at the identified points of contacts. Balancing the nurse or physician to patient ratio will increase efficiency and prevent unnecessary delays at major points of contact. Besides, cost planning will also enable smooth purchase of equipment without constraining the organizations revenue. Subsequently, staff training will also take place on the use of new equipment and innovation for a system innovation.
New product development is the ultimate plan to supplement system upgrade and increase efficiency. The innovational idea in this case is to fully integrate a Technology-assisted Workflow (TAWF) throughout the hospital’s operations. Kotter’s eight-stage model would be applicable in the innovation process to lead strategic change (Mezher and Sajid 2019, n.p). The stages involve establishing a sense of urgency for change, developing a guiding network, creating a vision and strategy, communicating strategy, empowering the action team, establishing short term goals, monitoring and evaluating success, integrating the innovative change into the broader organization’s culture (Naidu and Alicia 2019, p. 511). A TAWF-based software will support major clinical operations and documentation in the critical areas of contact. The software system is comprehensive and uses data from various systems and technologies such as high precision scales, pharmacist verification, and barcode readers (Farcy et al. n.p, 2021). The process of new system innovation, consequently, will begin with software and hardware selection.
Information Technologists, RN s, physicians, and pharmacists are the key professionals in the process. The IT exnetworks program the handheld devices, computer systems, and software while the RNs, pharmacists, and physicians would be the end-users. For example, during the BCMA system setup, the RNs should evaluate the speed of different Bluetooth barcode scanners (Naidu and Alicia, 2019 p. 511). The process is called product evaluation during software selection. Again, it is important to ensure that the software selected is viable in installation, encryption, Maintenace, and creating communication links among various hospital professionals (Farcy et al. 2021 n.p). Implementing the strategy would require cost planning to outsource the software and personnel. In addition, training of nurses, pharmacists, physicians, and community health workers is also important to increase knowledge of a new system. The hospital will additionally have a proper troubleshooting channel to report any malfunction and evade equipment failure.
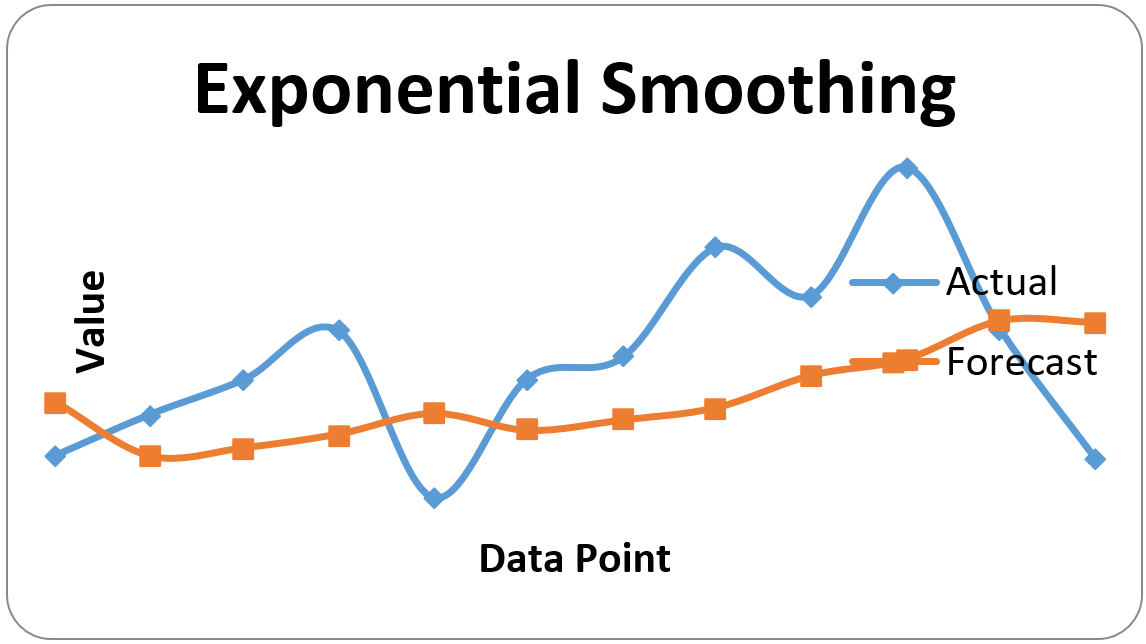
Exponential Smoothing Calculation
Calculation of 2021 Forecast for Syafunda Trading using the Exponential Smoothing
The requirements one would use for inventory management
One of a company’s most significant assets is its inventory. A company’s inputs and final goods form the foundation of its operation in retail, industrial, food services, as well as other inventory-intensive industries. A scarcity of inventory whenever and where it is required might be disastrous. Inventory, on the other hand, might be viewed as a concern. Large inventories are vulnerable to spoilage, theft, damage, and demand fluctuations. Inventory must be protected, and if it is not liquidated in a timely manner, it may be forced to be sold at clearance prices—or destroyed entirely.
For these reasons, inventory management is crucial for businesses of all sizes. When to replenish stock, how much to acquire or create, and what amount to pay — as well as whether and at what pricing to sell — are all challenging decisions to make. Small firms frequently maintain track of stock manually and use spreadsheet formulae to calculate reorder points and amounts. Enterprise global planning software will be used by larger companies. As a result, the biggest businesses rely on highly tailored software as a service solution.
Depending on the industry, different inventory management techniques are used. An oil depot may hold enormous volumes of product for long periods of time while waiting for demand to build up. While keeping oil is costly, there is no danger of the inventory spoiling or going out of style. Sitting on inventory is not an option for firms dealing in perishable goods or things for which demand is particularly time-sensitive – calendars or swift-fashion items, for example — and misjudging the timing or amounts of orders may be expensive.
There are other methods to analyze inventory. If a firm repeatedly changes its inventory accounting technique without good cause, it’s likely that its management is attempting to present a more favorable image of its organization than is genuine. Inventory write-offs on a regular basis might reflect a company’s problems selling completed goods or obsolete inventory. This can also create concerns about a company’s capacity to remain competitive and produce consumer-friendly items in the future. Thus, it is important to consider the requirements one would use for the inventory management.
Managing Syafundas inventory requires ability to use analytics and create customized reports to enhance the accuracy of its forecast. As result, the organization would need a reliable system that provides real-time data to track inventory from purchase to sales. In addition, the company also requires automation in its interface to eliminate manual processes to provide real-time updates on such trends (Reddicharla et al. 2019. n.p). The digital inventory management system should be easy to use and train personnel on its use. Streamlining the use of a digital inventory first require setting up a compatible system with the existing systems. The compatibility depends on the software vendors experience when purchasing the systems. Thus, the system should allow multi-location deployments and possibly enable use of wearables.
The contemporary trend in inventory management inclines to remote access and multi-location access. A remote inventory tracking system is significant in maintaining real-time movement of inventory especially perishable inventory (Reddicharla et al. 2019. n.p). The management would primarily major in identification and response to the new trends. From the Figure 2 there is an upward trend in the sales forecast, which is obvious from the original sales. However, the smooth forecast is relatively low denoting a lack of balance between price changes and sales. The digital inventory management system would enable the organization to streamline its inventories to avoid shortages.
Additionally, the organization should use the Economic Order Quantity (EOQ) method that help determine the number of units the company need to add to its inventory to evade the total inventory costs in the face of a constant consumer demands (Glock and Grosse 2019, p. 705). The EOQ method allows a company to order the right amount of inventory to avoid stockouts. Two types of costs such as total handling costs and total ordering costs would be important during the inventory management. The Total Ordering Costs (TOC) and Total Handling Cost (THL) are inversely proportional when certain amount of quantities are ordered (Glock and Grosse 2019, p. 705). Consequently, the business should find the point of trade-offs when ordering to minimize two types of costs.
The process of setting up a new inventory control system involves a breakdown and restructure of the total inventory from raw materials, sales and operations. The process known as inventory segmenting is important in setting up effective inventory control system. As a result, the organization minimizes their total inventory costs and set up costs.
Required: Time (t) Calculation Using the NETWORK formula
The following formula is based on the data presented in Figure 3, which serves as an exemplary project information:
PERT=(O+4M+P) / 6
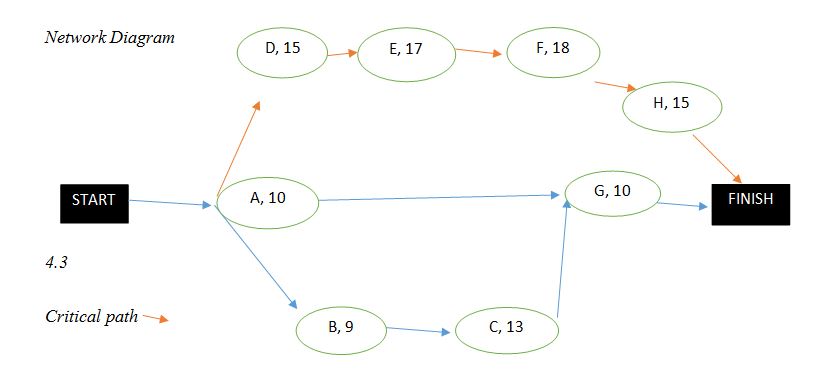
Figure 4 is a circuit based on the Activity-On-Node (AON) principle. From the data presented, it is possible to determine that the sequence is a variation of three possible paths (Figure 4). The first one is the most balanced, representing sequence A, B, C, G (Figure 4). The shortest path is A, G, leading directly to finish (Figure 4). However, the third path is a concept known as the Critical path – in particular, the sequence A, D, E, F, H; it is marked separately from the others (Figure 4). The scheme also presented the number of days each stage takes to complete (Figure 4). Thus, by defining the critical path, one may conclude that the total time duration will be 75 days.
The advantages of using network diagrams rather than Gantt Charts
Network Diagrams show the relationship between activities and indicate the critical path to take during the project (Tran et al. 2019 p. 322). Conversely, the Gant Chart only acknowledges that activities depend on the completion of others for them to start. As a result, the sequence diagram is critical in assisting a project planner in determining the quickest time to finish the project. Project managers may quickly break down complicated projects into distinct tasks, account for project cycles, and assign resources to reduce project time and costs by utilizing schematics in the Critical Path Method (CPM) (Bagshaw 2021, p. 216). Hence, managers may use the approach to control project time by optimizing the longest duration such as critical path.
Projects that are repetitive and small in size can use the Network diagrams because they lay out the operational network time, and costs for each activity. By constructing the AON diagram, a project planner can track which activities occur concurrently or the ones that need completion in prior. The methodology clarifies the critical path that would delay the project completion if not prioritized. Slack time is also a critical aspect that a project manager can easily identify from the network. The total slack refers to the extent by which one can defer activities without causing delay in the start time for subsequent activities (Bagshaw 2021, p. 216). Slack time is useful in key-decision-making about delaying non-critical activities when resource supply is unstable. Consequently, a slack can decide on terminating activities on critical path because one cannot postpone them.
However, in order to fully comprehend the advantages of network diagrams, it is important to study the situations in which each of the aforementioned types are most usually utilized. Both are visual project management tools, but there are several major distinctions between Gantt charts and network diagrams to examine before deciding which is best for your project. Gantt charts, like network diagrams, divide projects down into smaller tasks and show time restrictions. During the course of a project, however, project managers use Gantt charts to arrange tasks by date and demonstrate how much work has been performed. Every action is represented by a bar that runs from the activity’s start date to its termination date.
Network diagrams are used to plan and identify the time of each job before a project begins, thus they don’t have to reflect the project’s actual dates. They also do a better job of indicating whether activities must be performed in a specific order or if they may be completed concurrently. Both network and Gantt charts make project management easier by allowing you to see the entire project at a glance. It is important to consider utilizing both tactically to plan and implement one’s project, whether to use a network chart to plan the task or a Gantt chart to control and trace progress.
Though, using a Gantt chart does not provide the critical path and slacks for such decision-making which alters critical activity planning. Crashing is also major function of network diagram that makes it possible for the project completion. The concept implies a strategic reduction of activity time to allow project completion (Bagshaw 2021, p. 225). Project planners can crash the time of an activity to achieve the shortest time for project completion. When a project activity is lengthy, it means overtime work, more hiring, and additional raw materials. Projects may incur more direct costs when executing such activities. Therefore, crashing can help evade overhead expenses.
Reference List
Bagshaw, K.B. (2021) ‘NETWORK and CPM in Project Management with Practical Examples’, American Journal of Operations Research, 11(4), pp.215-226.
Beltrán Guzmán, I. et al. (2019) ‘Delays in arrival and treatment in emergency departments: Women, children, and non-trauma consultations are the most at risk in humanitarian settings’, PLoS One, 14(3), p.e0213362. Web.
Farcy, E. et al. (2021) ‘Use and impact of technology-assisted workflow (TAWF) systems for drug compounding in pharmacy practice: a scoping literature review’, Pharmaceutical Technology in Hospital Pharmacy, 6(1). Web.
Glock, C.H. and Grosse, E.H. (2021) ‘The impact of controllable production rates on the performance of inventory systems: A systematic review of the literature’, European Journal of Operational Research, 288(3), pp.703-720. Web.
Ho, JC, and Chen, H. (2018) ‘Managing the disruptive and sustaining the disrupted: the case of Kodak and Fujifilm in the face of digital disruption’, Review of Policy Research, 35(3), pp.352-371. Web.
Karami, N. (2019) ‘Review of Kodak’s Strategic Management of Technology. Why Kodak Failed?’, Engineering and Technology Management Student Projects, 2256. Web.
Kodama, M. (2018) Sustainable Growth Through Strategic Innovation. Edward Elgar Publishing.
Mezher, S. and Sajid, M. (2019) ‘How could NHS change management agents learn from corporate innovation strategy to deliver services more effectively?’, BMJ Leader, 3(2). Web.
Naidu, M. and Alicia, Y.L.Y. (2019) ‘Impact of barcode medication administration and electronic medication administration record system in clinical practice for an effective medication administration process’, Health, 11(5), p.511.
Reddicharla, N. et al. (2019) ‘Next-Generation Data-Driven Analytics-Leveraging Diagnostic Analytics In Model-Based Production Workflows. SPE Middle East Oil and Gas Show and Conference’. OnePetro. Web.
Schröder, H. et al. (2021) ‘Tele-EMS physicians improve life-threatening conditions during prehospital emergency missions’, Scientific Reports, 11(1), pp.1-11. Web.
Taffel, S. (2021) ‘Google’s lens: computational photography and platform capitalism’, Media, Culture & Society, 43(2), pp.237-255.
Tran, D.H., Chou, J.S. and Luong, D.L. (2019) ‘Multi-objective symbiotic organisms optimization for making time-cost tradeoffs in a repetitive project scheduling problem’, Journal of Civil Engineering and Management, 25(4), 322-339.