The cost schedule and output rate
Marginal cost is calculated by determining changes in the total cost when the rate of output increases by a single unit (Mankiw, 2016). The fixed cost remains the same for all rates of output. The average fixed cost is calculated by dividing it by the rate of output (Mankiw, 2016). The variable cost is determined by calculating the difference between the total cost and fixed cost (Mankiw, 2016). The average variable cost is calculated by dividing the variable cost by the rate of output (Mankiw, 2016). Lastly, the average total cost is calculated by dividing the total cost by the rate of output (Mankiw, 2016).
Table 1. Calculation of Cost Schedule.
The average total cost is minimized when the rate of output is either 3 or 4. However, the higher rate of 4 has been selected for this purpose (Mankiw, 2016).
The cost data plotted as the ATC and MC curves
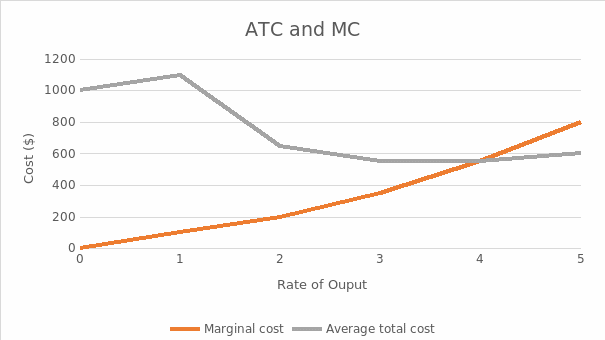
The average total cost and marginal cost are plotted in Figure 1.

Figure 1 shows that the marginal cost exceeds the average total cost after the rate of output crosses four. It is not feasible for the company to increase the rate of output beyond four because the average total cost would then increase and the business’s profit would decline (Mankiw, 2016). As the figure shows, the average total cost is $550 at the rate of output equal to four, and it rises to $650 when the rate of output becomes five.
Conclusion
It is crucial to estimate the costs of production, including fixed and variable costs. Notably, the average total cost continues to fall until the marginal cost remains below it. This implies that the benefit of increasing the rate of output diminishes, and the company should keep it at the level of four to maximize profit because at this level, the average total cost is at a minimum.
Reference
Mankiw, N. G. (2016). Principles of microeconomics (8th ed.). Mason, OH: Cengage Learning.