Global inequality is a complex issue, the measurement of which is complicated by the number of factors involved. The problem of global economic inequality has pushed its way into the national and international conversation and the ongoing debates about the need to raise the minimum wage to ensure the improvement in the population’s quality of life quality. However, the measurement of economic inequality is challenged by the evidence of a wide partisan gap in whether inequality is a problem that needs addressing (Milanovic, 2012). Besides, economists also have varied views on defining and measuring inequality. As suggested by Kennickell (2019), at first glance, economic inequality may seem a simple notion at first; however, operationally, it may include a variety of things based on the perspective being applied. There is general agreement that wealth is more unevenly distributed compared to income. Thus, it is imperative to look at the differences in the measurement and estimation of economic inequality, drawing from the discussions of the process of global income convergence within the last three decades.
Methods of Measurement
Complications with the measurement and estimation of global inequality stem from economists’ different approaches to measurement, including the Gini coefficient, the Lorenz curve, the Palma ratio, the decile ratio, and others. Equally as important is the consideration of what should be measured, whether it is consumption, pre-tax and after-tax income, or wealth, while also considering income sources such as capital gains, taxes, wages, and benefits (Trapeznikova, 2019). Thus, before economists choose a specific metric, they should make a decision about the dimensions of economic inequality to be measured. Such a choice is imperative not only from the conceptual standpoint but also because of the need to determine the instruments available to policymakers when correcting a given distribution.
While inequality of opportunity, characterized by the access to education, skills, health care, or work opportunities, is essential, inequality of outcomes is more likely to be measured because it is representative of the readily observable and measurable indicators of living standards, such as wealth and income (Sutcliffe, 2004). The next step entails distinguishing between income, wealth, and pay inequality as instrumental for showing disparities in wealth. Specifically, pay inequality represents differences in wages paid to different people, reflecting the variability in workers’ productivity, labor market discrimination of specific groups, and differences in the nature of the job.
Income inequality denotes the extent to which income is unevenly distributed across individuals and households. It captures labor-related earnings, capital income from dividends, interest on saving accounts, state pensions, and other relevant governmental transfers. Besides, it is possible to distinguish between individual versus family income, pre-tax versus after-tax disposable income, and labor earnings versus capital income. The final dimension of economic inequality in differences is wealth distribution, representing the stock of all assets that a person holds. These include a range of financial assets, such as savings, property, and stocks. It is also notable that income and wealth are not perfectly correlated because high earners may be in the higher end of the income distribution while being relatively poor when it comes to assets. Conversely, an elderly worker may have accumulated significant wealth while having low labor earnings.
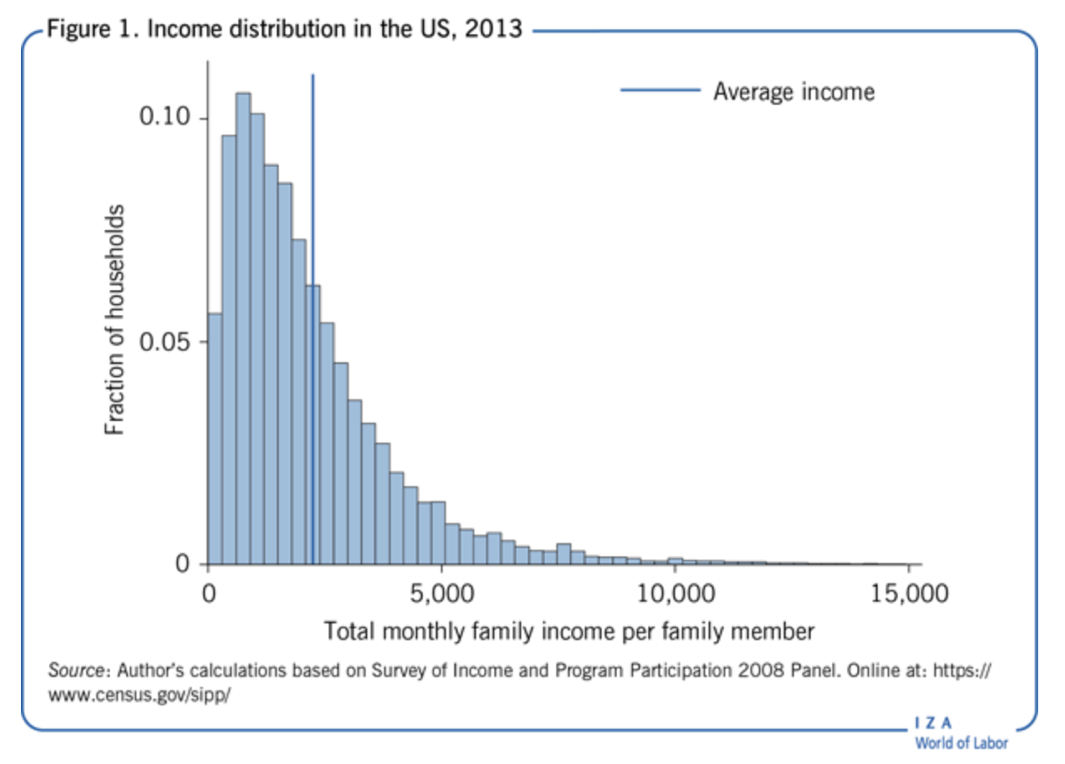
The measurement of inequality among countries is concerned with the comparison of the distribution of wealth or income over a set period of time. The graph below illustrates income distribution in the United States, with the skewed shape with a long tail being typical for income distribution (see Figure 1). This means that most households earn below the average while very few households earn a very high income. Measures of inequality make an attempt to capture the dispersion of such a distribution. To be successful in comparing income distributions across countries over some time, inequality measures have to satisfy several criteria.

Specifically, there is a principle of anonymity, which means that all personal labels permutations within a given distribution, such as who earns what, should not have any effect on overall inequality. The population principle needs to be met in terms of ensuring that the measures of inequality are independent of an economy’s size. Thus, economists will find it possible to compare inequality in small and large countries regardless of the size of population and its aggregate income (Milanovic, 2012). Another important criterium is the relative income principle, which means that only relative income matters in the measurement of inequality, not income levels. Finally, inequality measurements must also satisfy the transfer principle, which entails the reduction of inequality when a certain amount is transferred from a richer individual to a poorer one while the recipient remains poorer than the donor.
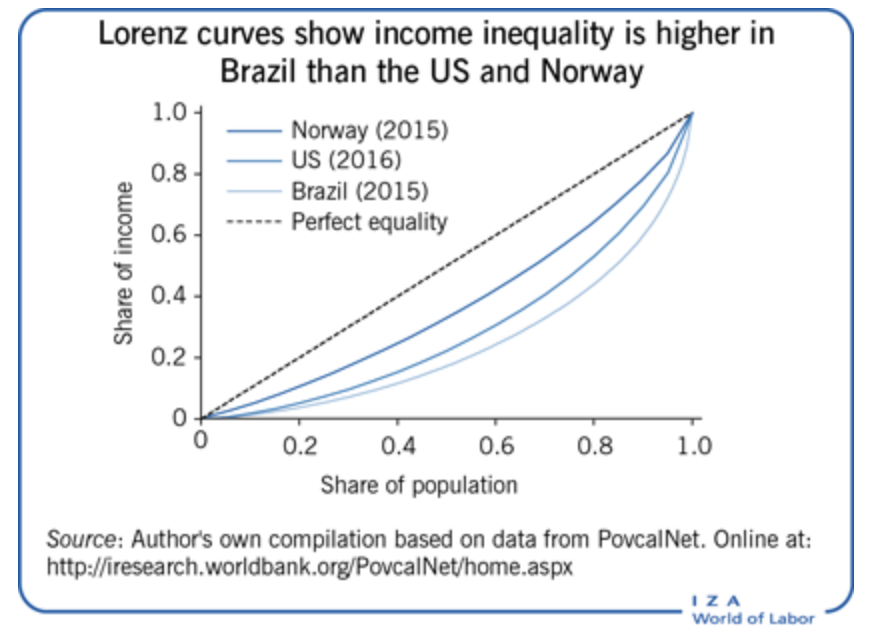
The Lorenz curve and the Gini coefficient are the most commonly used methods applied in the measurement and representation of income inequality. While the Lorenz curve (see Figure 2) is a metric allowing for the quick visual comparison of inequality among countries, the Gini coefficient involves data from the entire distribution of income regardless of the size of a country’s population or economy in question (Trapeznikova, 2019). In the Lorenz curve graph, the cumulative share of income is represented by the y axis as earned by the poorest percentage of the population for all possible values on the x-axis. The 45% line denotes the line of equality when income is shared equally among all residents. However, if income is not shared equally, the curve is below the equality line, suggesting that the bottom percentage of the population earns less than the percentage of the total income in the country.

Following from the example of the Lorenz curve discussed above, it should be mentioned that the Gini coefficient is closely linked to it. It is defined as the area between the curve showing income inequality and the 45% equality line. Gini takes a value between 0 and 1; the lower the Gini value, the more significant is the equality in the country (Sutcliffe, 2004). The value of 0.5 and more is considered an indicator of high inequality, which characterizes countries such as South Africa (0.63), Namibia (0.59), Suriname (0.576), and Zambia (0.571), leading the list of the most unequal states globally (Index Mundi, 2019). The lowest Gini value is in countries such as Ukraine (0.25), Belarus (0.254), Slovenia (0.254), Moldova (0.259) and Chech Republic (0.259) (Index Mundi, 2019). It must be noted that the values of the Gini coefficient change depending on what is measured, whether it is wages, wealth, consumption, or before- or after-tax income.
Besides the Gini coefficient, there are other measures of inequality globally that summarize data from the entire distribution of income. Specifically, economists have used the coefficient of variation (CV) and the variance of the natural logarithm of income. The CV equates to the ratio of the standard deviation to the average income, and because it measures variability in relation to the mean, it does not depend on income levels. In a similar vein, the variance in log income is invariant of scales. Both CV and the variance of the natural logarithm of income agree with the Gini coefficient rank in instances when Lorenz curves do not cross but may differ in ranking.
Economic Convergence Considerations
In the 1990s, the was a trend of developing economies beginning to grow faster as compared to their advanced counterparts, in per capita terms, which inspired optimism that the output of the two groups could converge. Between 1990 and 2007, the average annual per capita growth of developing economies was 2.5 percentage points higher compared to their advanced counterparts (Derviş, 2018). Furthermore, in the period between 2000 and 2007, the gap increased to 3.5 percentage points (Derviş, 2018). Notably, although not all small economies progressed rapidly, on the aggregate level, the global economy changed, with Asia countries being particularly active led by the dynamic economies of India and China.
However, after the global financial crisis starting in 2007, the dynamics were shifting. At first, it appeared that convergence was accelerated, with advanced economies slowing down while the developing countries led in per capita growth increasing to 4 percentage points (Derviş, 2018). Later, by 2013-2016, many emerging economies slowed down in their growth, especially when it comes to Latin American countries, while the growth of the US increased (Derviş, 2018). While this does not necessarily mean the end of convergence, the worldwide technological advancement and the advent of cutting-edge robotics, AI, and bioengineering technologies made it harder for developing countries to show their cost advantage. However, convergence remains possible because of the potential to upgrade developing countries through investment in technologies. Developing economies will learn faster than advanced efficiencies to catch up with developed states. In addition, the countries will have to deploy new technologies in an efficient way, considering the role of labor-market skills and regulations. This task will not be easy to accomplish, and there are low chances of returning to the perfect state of convergence that was set before 2007.
It is notable that despite the per capita growth in developing economies due to the inflow of foreign investment, the automatic decrease in inequality should not be expected. In contrast, free markets are likely to increase income inequality within a country while lowering inequality between developed and developing economies. Moreover, declines in income inequality within countries cannot be achieved without the specific investment in technological advancement and human capital. On the one side, the example of countries such as China shows that tax reforms are necessary to be put in place to increase social program revenue (Lam & Wingender, 2015). On the other side, the example of Argentina shows that a country puts itself at a disadvantage when significantly relying on the export of agriculture for economic growth (OECD, 2019). Thus, successful economic convergence and the decreased economy is achievable if governments introduce policies for accumulating human capital, promoting technological progress, and establishing a welfare state.
References
Derviş, K. (2018). The future of economic convergence. Web.
Index Mundi. (2019). GINI index (World Bank estimate) – Country ranking. Web.
Kennickell, A. (2019). The tail that wags: differences in effective right tail coverage and estimates of wealth inequality. The Journal of Economic Inequality, 17(4), 443-459.
Lam, W. R., & Wingender, P. (2015). China: How can revenue reforms contribute to inclusive and sustainable growth? IMF Working Paper. Web.
Milanovic, B. (2012). Global income inequality by the numbers: In history and now. Policy Research Working Paper. Web.
OECD. (2019). Agricultural policies in Argentina. Web.
Sutcliffe, B. (2004). Global world inequality and globalization. Oxford Review of Economic Policy, 20(1), 15-37.
Trapeznikova, I. (2019). Measuring income inequality. IZA World of Labor, Web.