Company Background
Microsoft is an American software maker and one of the largest multinational corporations in the world. It was founded in 1975 by Bill Gates and Paul Allen. The company’s headquarters is located in Redmond, Washington. Microsoft has become one of the most prominent players in the software market thanks to the Windows operating system it developed, the first version of which appeared in 1985 (Microsoft, 2022). This OS is still the most widespread in the world. Another popular Microsoft product is Microsoft Office document management software. In addition, the corporation develops computer games and produces Xbox game consoles.
This organization occupies a solid leading position in the stock market for several reasons. First, Microsoft proved to be the pioneer in the most promising field of technical and technological developments, which are actively used in many areas of human activity. Secondly, having developed a large corporation, the company has financial resources for introducing constant innovative developments that allow maintaining the release of relevant products in several areas. Finally, Microsoft is active in environmental and social responsibility, aligning with sustainability trends. As a result, the corporation conducts complex activities, supporting most of the directions in its activities, which keeps the company at the top of the market.
Currently, cloud segments and software, widely used in education, medicine, and many other sectors of the economy, bring the most significant profit. However, current external factors are adjusting to the global structure of the world, which also has a noticeable effect on the technology industry. Despite its leadership position, Microsoft has struggled in 2022, as has the rest of the tech sector. Revenue growth began to slow down, even in the cloud segment. Optimization of operating costs has also become relevant for the company. As a result, the future reduction of 10-11 thousand employees was announced. For the past six months, stocks have looked weaker than the broad market, although previously, big techs were considered defensive assets to some extent. Over the medium term, the stock’s upside potential is modest.
Although the cloud segment is still profitable, albeit on a smaller scale, several industries within the company affect its strong position in the market. The most problematic segment is Personal Computing, whose revenue in the 2Q 2023 fiscal year decreased by 19%. Within this segment, pre-installed Windows revenues fell 39% yoy due to lower global PC shipments and will decline by 35-40% next quarter. In December 2022, Microsoft acquired a 4% stake in the capital of the London Stock Exchange and announced a 10-year partnership with the platform (Microsoft, 2022).
At the same time, by the end of 2022, it became clear that the deal to buy Activision Blizzard might not go through under pressure from antitrust regulators (Reuters, 2023). Microsoft started 2023 with a $10 billion investment in the OpenAI project, which is the creator of a new conversational AI model in the form of the unique ChatGPT chatbot. It is just one of the stages on the way to the strategic goal – introducing AI in all products and services.
The success of this approach could determine the outlook for Microsoft and its stock prices in the coming months and years. At the moment, Microsoft is slightly behind the S&P 500 benchmark, which may be due to many significant investments. The company survived the pandemic crisis relatively well, significantly breaking into the market for relevant software that provides remote interaction, which allowed it to increase revenue at the current pace for those years. However, new global challenges, such as the East European conflict and climate change, requiring the intervention of large corporations, may not only prevent Microsoft from implementing projects but also reduce the potential demand for its products. This paper assesses the company’s WACC to understand its current position better.
Equations
Cost of Equity
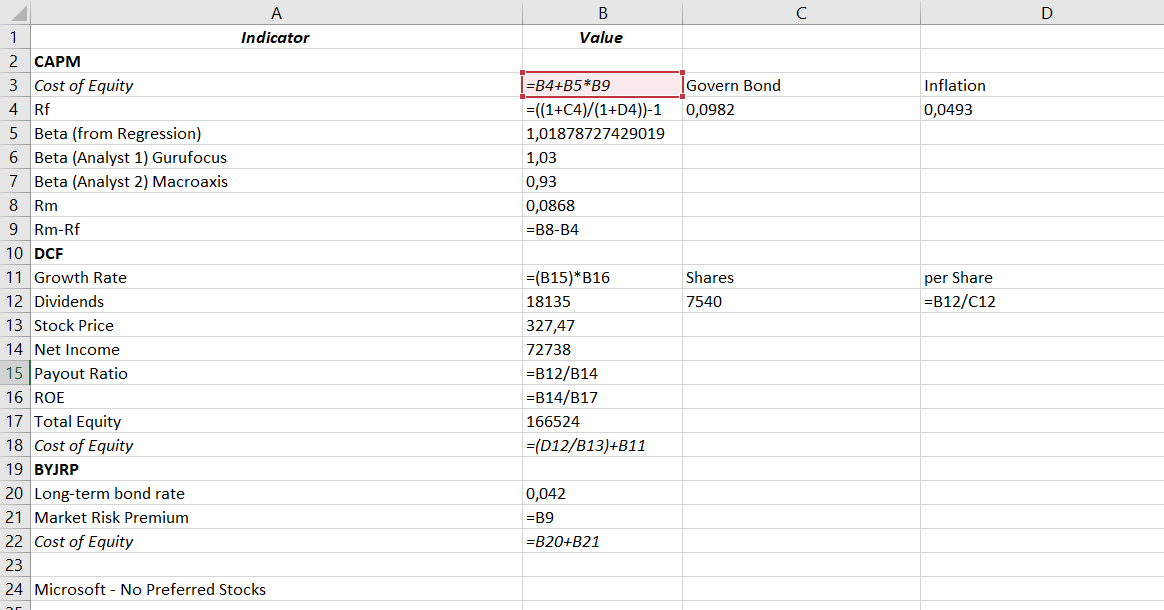
The cost of equity is a critical metric needed to calculate Microsoft’s WACC. It can be obtained in various ways, and in this paper, three options are given, each of which different values are obtained: CAPM, DCF, and Own-Bond-Yield-plus-Judgmental-Risk-Premium. In the first case, the CAPM method, it is necessary to calculate the cost of equity using the following formula:
Cost of Equity = Rf + β(Rm – Rf)
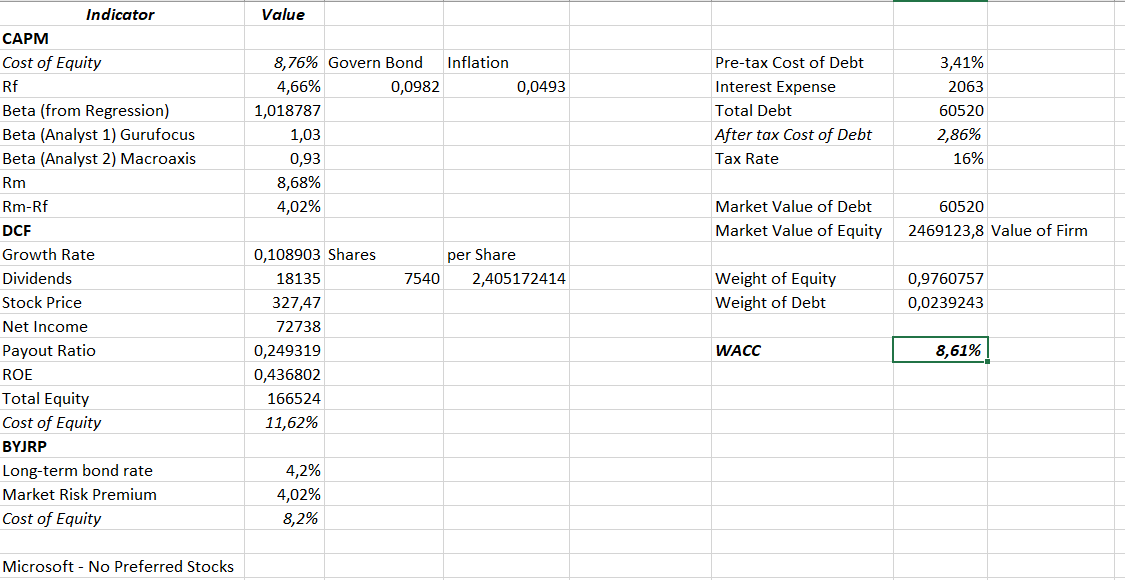
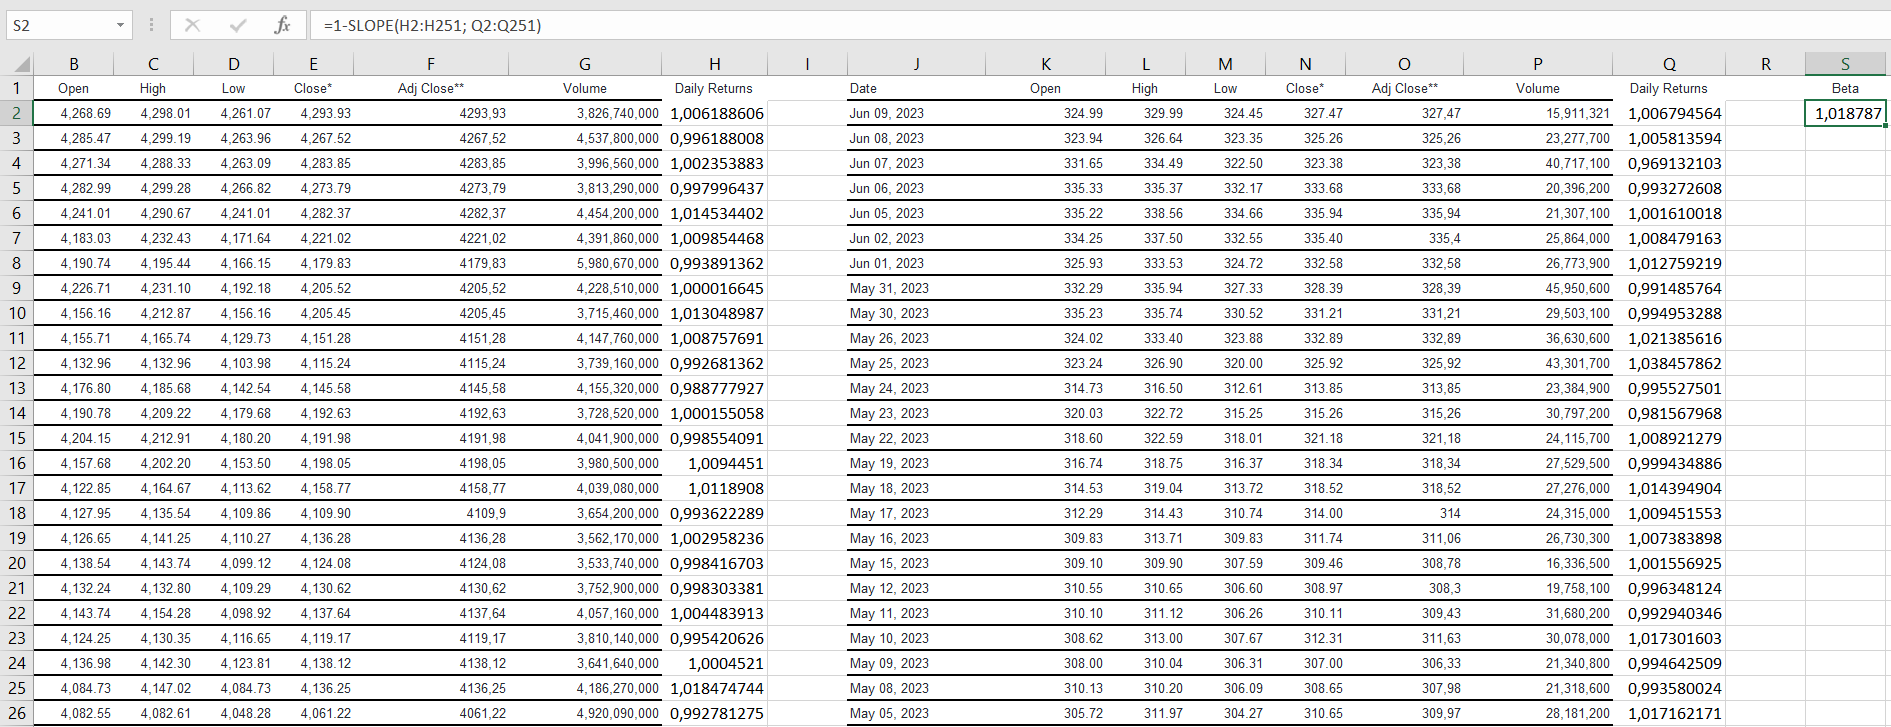
In this case, this means the risk-free rate of return measures the volatility of a stock relative to the market as a whole and stands for a market risk premium. In this case, the beta is the most exciting indicator since there are several options for its manual calculation, and it is also possible to rely on the opinions of experts and companies in this matter. The work used the regression method to obtain beta: for this, information on daily prices for Microsoft shares and the S&P500 index for the last year was exported to Excel, relative daily price changes were calculated, and then, using the slope function, a beta equal to 1.0187 was obtained. All calculations are tabulated in Appendix A.
The resulting ratio means that, in general, Microsoft shares follow the market and have almost low volatility since the value is quite close to one. For comparison, two opinions of expert sites conducting evaluation activities were taken. Gurufocus rated corporate beta at 1.03 and Macroaxis at 0.93 (Gurufocus, 2023; Macroaxis, 2023). The manually obtained value lies between these expert estimates. Therefore, it will be used to calculate the cost of equity.
The risk-free rate of return is most often determined by the formula below:
Rf = (1+ Governmental Bond Rate) / (1+ Inflation Rate) – 1
Therefore, having received the indicated data from official sources for the US, where Microsoft is headquartered, it was found that the bond rate is 3.74%, and inflation is 4.93% (TradingEconomics, 2023a; TradingEconomics, 2023b). Thus, the calculated indicator was at the level of 4.66%, which roughly correlates with similar estimates from other experts. Strong inflation dynamics may dictate deviations from this value.
The market risk premium can be obtained as the difference between the expected rate of return and the risk-free indicator. The benchmark can also be the S&P500, which offers 10-year statistics equal to about 9% expected return (Royal & O’Shea, 2023). Although this indicator differs from the risk dynamics for a longer or shorter period, since the 10-year Treasury Rate was taken for the risk-free rate of return, it is logical to use the risk for the market for the same period. Accordingly, subtracting the received data for Microsoft, this indicator equals 4.02%.
Applying the CAPM formula above, the cost of equity in this case was 8.76%. Given the low volatility, this value was relatively high due to the approximately equal market risk premium and the risk-free rate. Microsoft has relatively low risks, which, against the background of the description from the introduction, either signal a delayed potential for the manifestation of these problems or that the company is coping with current issues quite well at the moment.
The discounted cash flow method can be used if the company pays dividends. Microsoft pays them quarterly, so this method applies to this organization. The cost of equity, in this case, is calculated using the following formula:
Cost of Equity = Dividends per Share / Stock Price + Growth Rate
Growth Rate = Payout Ratio × ROE
Payout Ratio = Dividends / Net Income
ROE = Net Income / Total Equity
As seen from several of these formulas, first of all, it is necessary to calculate the ROE and payout ratio. The information for these formulas was taken from Microsoft’s annual financial report (Microsoft, 2022). As a result, the equity cost was 11.62%, according to the Excel calculations shown in tabular form in Appendix A. It is very likely that more dividends paid out this year and significantly increased net income contributed to a noticeable increase in this indicator. The overestimated value obtained by this method will not be used to calculate WACC in the future. However, it gives an essential understanding of how high dividends for shares are in the current conditions and how they affect the calculated indicator.
Finally, the most exact cost of the equity method, Own-Bond-Yield-plus-Judgmental-Risk-Premium, can be calculated using two values. The first is the long-term bond rate, which, according to experts, is 4.2% for Microsoft. The second is the market risk premium already received above, referred to as the judgmental risk premium – equal to 4.02%. By adding these values in Excel, it was found that the cost of equity, in this case, will be equal to 8.22%, which is generally closer to the CAPM model than to DCF. As a result, the most complex calculations included the CAPM model, where the average was obtained between all three costs of equity methods, respectively; this value will be used in the future to calculate the WACC.
Cost of Debt
In addition to the cost of equity, it is necessary to calculate the cost of debt, which, unlike the previous indicator, has a single solution method. Microsoft does not pay dividends on preferred stocks. Therefore, this ratio is excluded from further calculations (Microsoft, 2022). The cost of debt is calculated using the following formula:
Cost of Debt = Interest Expense / Total Debt
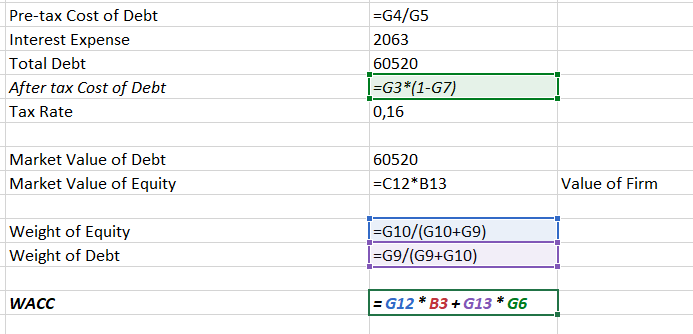
These values were also obtained from Microsoft’s financial statements. Unfortunately, information about all issues of bonds with the weighted average cost of debt is closed for this company; therefore, the final values were taken for the calculation. In this respect, the corporation’s annual interest payments are $2,063 in millions, while Morningstar’s total debt is estimated at $60,520 (Morningstar, 2023). As a result, the cost of debt will be 3.41%.
Market Values, Weights, and WACC
Then, the market values of debt and equity are needed. A higher value of 60520 in millions of dollars can be used for debt. For equity, a market cap is calculated by multiplying the number of shares by their current value – the result is about 2.5 trillion dollars. These indicators allow for the calculation of the weights for final use in the WACC formula. Essentially, weight is – in this case – the percentage of a company’s debt to its equity. As calculations revealed, the capital is more than 97%, while the debt is just over 2%. Therefore, the calculation of WACC was made according to the formula:
WACC = Equity Weight × Cost of Equity + Debt Weight × Cost of Debt
The WACC value for Microsoft turned out to be 8.61%. An interpretation of this analysis is given in the next chapter, Assumptions.
Assumptions
Microsoft’s ROIC percentage is 25%, well above the WACC. This fact indicates that the company generates excess positive profit, which is directly proportional to the organization’s future value. Therefore, despite all the problems identified, Microsoft is a successful and profitable company whose shares should at least be held since its stable growth can be the right solution for portfolio diversification and asset preservation. The identified risks are similar to the market on average, while the beta calculated experimentally or obtained from experts indicates low volatility. As a rule, these powerful technology corporations either follow the market’s movement or set trends in it since the success of many business industries depends on their developments.
For calculations, only authoritative publications and official sources were used – most of the information was taken from Microsoft’s financial statements for 2022. For 2023, such indicators have yet to be available since the report is released after June, the end of the billing period for the company. While stocks were valued on a to-date basis, the potential limitations of this analysis could reveal such a critical delay in a significant change in financial ratios for 2023. However, updating the calculations will be required only in case of noticeable changes – in other scenarios, the deviations from the values obtained in this work will be insignificant.
Excel has been used as the most convenient tool for visualizing data in spreadsheets and processing them using formulas. The large tables of historical stock data taken to calculate the beta for last year’s data included at least 300 different values for the S&P 500 index and Microsoft. Formulas were dictated by the teaching literature and relevant, reliable sources, where numerical values were presented, and translational calculation methods were presented. Although, in some cases, the analysis could be improved by a larger sample or a multi-criteria approach, the results obtained are approximately equal to those on the specialized WACC assessment sites and only confirm this fact.
However, the WACC estimate could noticeably change when choosing other methods and the values obtained, for example, for the cost of equity. Still, in all potential cases, it would be lower than ROIC. Microsoft is a relatively efficient and profitable company. The analysis showed a structural approach to maintaining low debt amid high equity, partly due to the company’s technological success – huge funds are allocated to R&D and innovation, critical aspects of competitive activity in this market.
Conclusion
Despite several potential external risks, Microsoft still has a reasonably wide margin of safety. The brand has length and has already launched projects that will allow it to be a minimarket leader in the market. Ultimately, such factors affect the entire industry, so even the negative dynamics of the calculated indicators can lead to a similar movement of the whole market, leaving the WACC and its associated coefficients at about the same level.
References
Gurufocus. (2023). Microsoft (NAS:MSFT) WACC. Web.
Macroaxis. (2023). Microsoft Beta. Web.
Microsoft. (2022). 2022 Annual Report. Web.
Morningstar. (2023). Microsoft Corp MSFT. Web.
Reuters. (2023). Activision intervenes in Microsoft challenge to UK regulator’s block. Web.
Royal, J. & O’Shea, A. (2023). What Is the Average Stock Market Return? Nerdwallet. Web.
TradingEconomics. (2023a). United States Government Bond 10Y. Web.
TradingEconomics. (2023b). United States Inflation Rate. Web.
Appendix A


