Introduction
A market economy strongly relies on its two main concepts – demand and supply that correlate under the conditions of a free market. Both demand and supply are affected by economic factors and shift according to the change in prices. However, there are external factors that influence these phenomena, such as strong advertising campaigns, tastes, and trends, or the change in prices of competitive or complementary goods. Market equilibrium is the term that defines such a condition of balance in a competitive market. According to Sloman and Garratt (2013, p. 19), “the equilibrium price is the price where the quantity demanded equals the quantity supplied: the price where there is no shortage or surplus.” Thus, when there is a reduction in supply, the demand rises, and so do the prices.
In order to analyse how demand and supply of a specific good change, it is necessary to consider the characteristic market features of this good. As a product of everyday use, milk is distributed in large amounts in the UK market and consumed almost daily by most households. It is a complicated good for the analysis, as its demand and supply depend on different factors. Apart from exclusively economic impacts, milk supply changes depending on the season, weather conditions, production technologies, and cow epidemics. All these conditions have an immediate effect on prices, thus reducing or increasing demand.
Role and Characteristics of Milk in the UK Market
Cow milk is the most common milk consumed in households across the UK. In order to effectively evaluate this type of good, it is necessary to consider all factors that influence its supply and demand. First, milk is not suitable for long-term storage. This means that the majority of milk consumed in a country should be produced locally. Moreover, the time between production and consumption is generally short, so the changes in the supply affect the prices immediately. Secondly, the production of milk is seasonal in the UK with the annual cycle, which is also reflected in how the prices change within a year. And lastly, the supply can differ due to the weather conditions as heat and the level of precipitation also influence milk yields.
Besides the mentioned above external causes, different economic-related factors determine the supply and demand of milk. One of the most potent market-regulating forces is the competition, so milk producers have to align their prices regarding both local and foreign competitors. Costa-Font and Revoredo-Giha (2017, p. 112) consider the abolition of EU milk production quotas of 2015 as the turning point for the UK dairy industry, forcing it “to operate closer to free-market conditions.”
According to the scholars, domestic prices on milk have been reduced as the result of alignment with global prices (Costa-Font and Revoredo-Giha, 2017). Moreover, local dairy producers have to compete not only with foreign market players but also with businesses that distribute substitute goods. Consumption of non-dairy milk made of soy, coconut, or oats has been recently promoted through aggressive advertisement campaigns.
Milk Supply and Demand in the UK Market
The observation of any goods distributed and produced under the competitive market conditions can illustrate the concept of a competitive market. As it was mentioned above, the milk production industry no longer has any restrictions in production amounts, so the example of milk in the UK market is suitable to demonstrate how the equilibrium is achieved. The increasing demand for milk products means that the consumers can buy it even at a higher price than before, so it becomes more expensive.
Sloman and Garratt (2013, p. 20) explain that any change in supply or demand forces markets to adjust prices to restore equilibrium. However, the supply of milk depends on several determinants, including season and weather conditions.
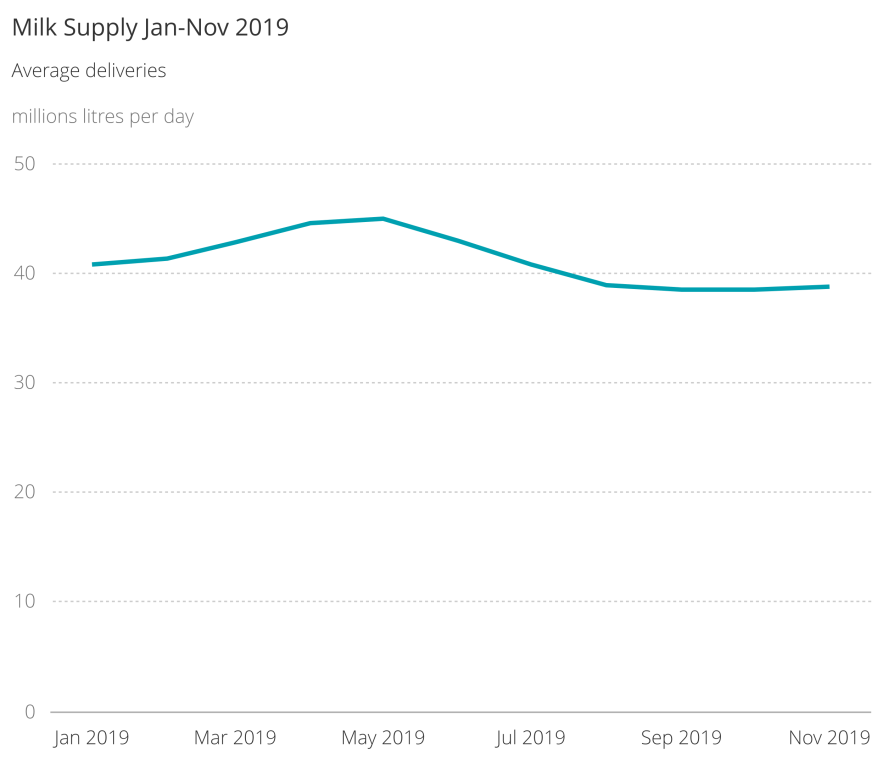
The data in Figure 1 is collected by Agriculture and Horticulture Development Board (AHDB) and shows the average daily amount of milk delivery in the UK from January 2019 to November 2019 (AHDB, 2020). The graph represents the local milk supply in millions of litres per day (average for each month) for the eleven available months. The increase in supply begins in February and reaches its peak in May (45 million litres).
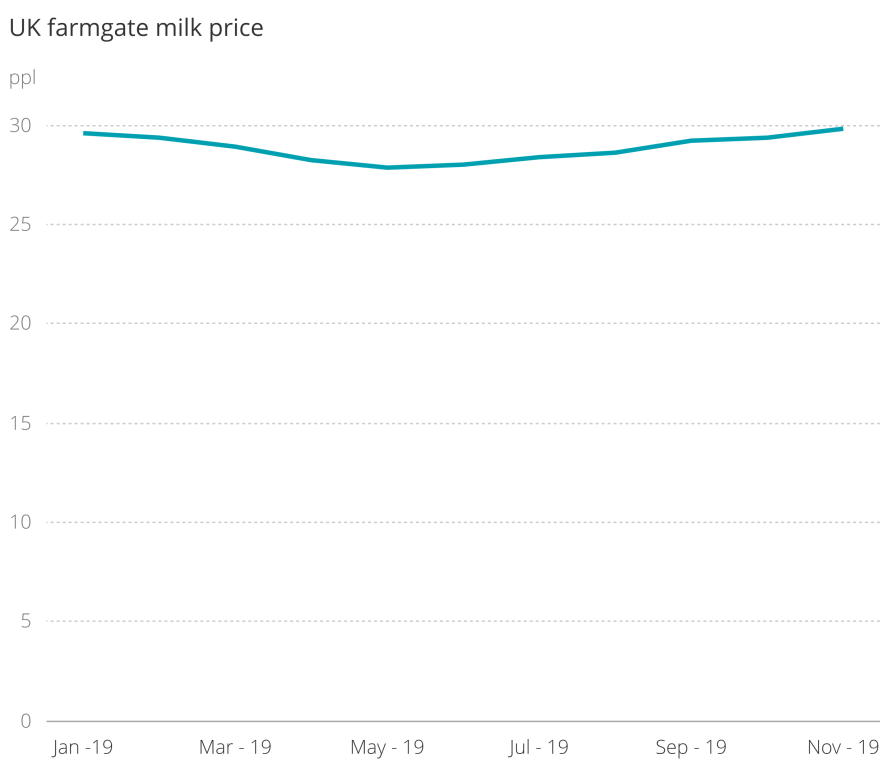
The average prices for dairy milk of the UK origin have been calculated for the same period (AHDB, 2020). Figure 2. presents the graphic illustration for the tendency. The prices vary from 27.84ppl (pence per litre) in May to 29.85ppl in November. It is evident that the highest levels of supply show the reduction in price and the scarcest production quantity is responded with the highest price. The data in Figure 3. is presented without a chronology to demonstrate the correlation between price and supply.
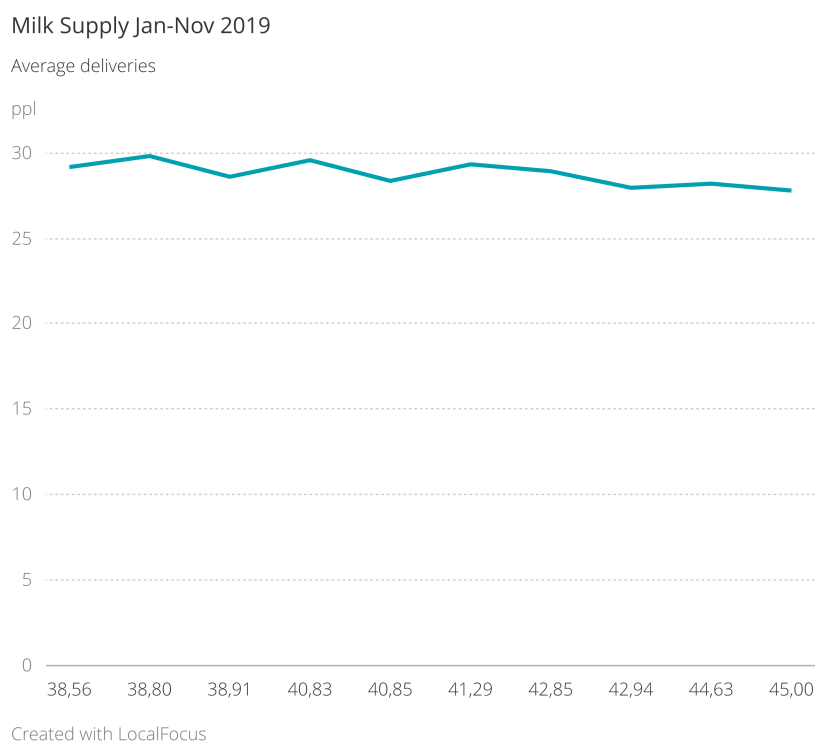
The graph illustrates a specific correlation for this type of good. Generally, supply and price curve has the opposite tendency – as the price grows, the businesses tend to produce more. However, farmers do not often have a choice of how much milk to produce, as these amounts are determined by external circumstances, such as the season and nature. Downward sloping supply and demand curve can be explained by the characteristic features of the good. In this case, it means that this is the supply that determines prices, but not the prices that determine supply. As the quantity decreases, consumers are ready to pay higher costs, so the demand goes up. That is why the diagram for the milk market equilibrium is inversed.
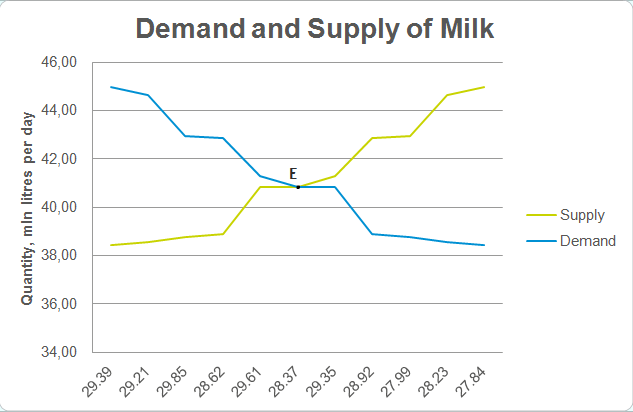
The graph of demand and supply shows that the lowest supply is characterised by the highest demand and price. When the supply increases and surplus occurs, the price goes down. The point Eon this graph signifies the condition when the demand and supply of milk are equal. The equilibrium is achieved at the amount of about 41 million litres daily and the farmgate price of 28.37ppl. The analysis of the data shows that this condition was reached in July 2019.
Market Interventions that Influence Milk Supply and Demand
Market equilibrium in a free-market economy is reached naturally due to the competitive forces. However, in practice, such processes do not always lead to the maximum efficiency of the market system. When the economy is not regulated, local goods can be overruled by foreign competitors or monopolies, and this process negatively affects the industry and the labour market. Moreover, so-called ‘random shocks’ that depend on nature may happen and threaten the whole industry.
That is why governmental interventions are needed in some cases to provide a short-term stabilisation, create workplaces, regulate the ecological footprints, or to restore fair competition on the market. Although most markets have a different degree of governmental intervention, they can be defined as mixed market economies. Dairy production businesses in the UK have to comply with a number of standard governmental policies that typically regard ecology legislation and labour policies and which are compulsory for all the industries. However, Davidson (2017) argues that given the global downturn in prices for milk and an increase in milk supply, further interventions are likely.
The previous supply and demand charts show the analysis conducted within one year, which depends on the natural conditions that impact the yields of milk. However, long-term observation shows that changing prices affect the number of farms and cows, so this impact has economic nature. Costa-Font and Revoredo-Giha (2017) study the effect of EU quota abolition in 2015 on the UK milk market. Since the limitations were removed, the prices gradually began to decrease, aligning with global rates (Figure 5), resulting in a decrease in supply (Figure 6).
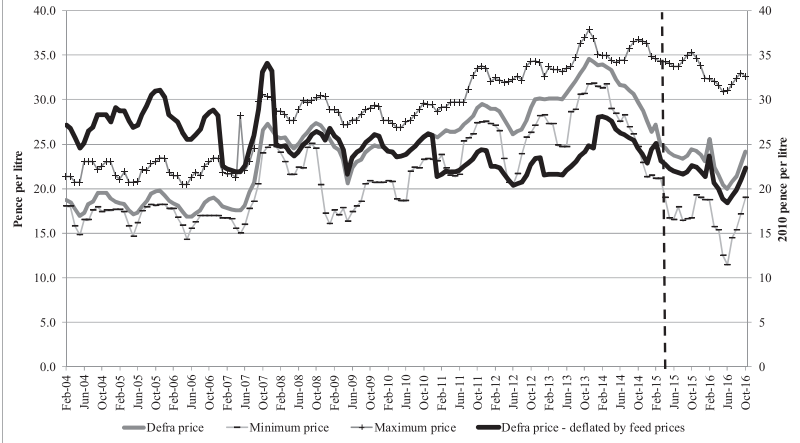
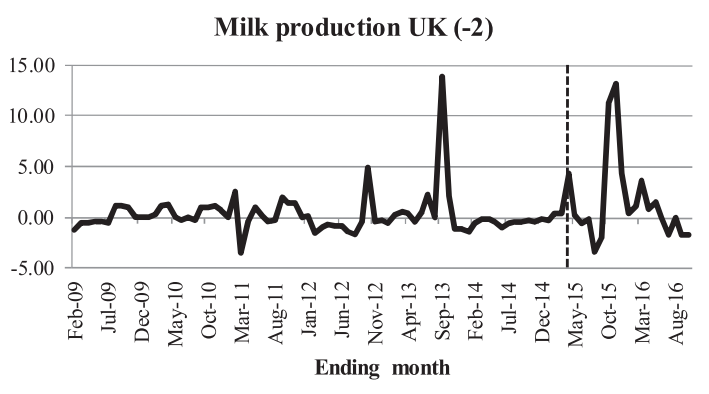
The graphs show that the global free market conditions are unfavourable for the UK milk market. The abolition of quota resulted in increased competition, which reduced prices. Given the high cost of labour and production in the UK, it led to a shortage of supply and might have an adverse effect on the whole industry. So the feasible future interventions would concern the protection of the national producer on the UK market, which would help the dairy businesses keep prices and salaries on the acceptable level for the country.
Conclusion
The correlation of demand and supply is a vital force of a competitive market. This correlation is analysed on the example of milk in the UK. Dairy production is a specific industry that is highly seasonal and depends on several other external circumstances. Still, the case of milk in the UK market proves that changes in price are the natural response to the shifts in demand and supply. Besides the local relationship, the industry is affected by foreign competitors, so governmental intervention may be a legitimate measure to protect the local producers.
Reference List
AHDB: UK farmgate milk prices (2020) Web.
AHDB: UK monthly milk deliveries (2020) Web.
Costa-Font, M. and Revoredo-Giha, C. (2017) ‘An empirical analysis of UK milk contract prices 2004-2016’, Agribusiness, 34(1), 112–141.
Davidson, R. (2017). ‘Is there an environmental silver lining in low milk prices?’ 61st AARES Annual Conference, Brisbane, Australia.
Sloman, J. and Garratt, D. (2013) Essentials of Economics. 6th edn. Harlow, UK: Pearson.