Introduction
One of the most important merits of MRI is the capability to create high contrast images particularly for soft tissues. This ability enabled it to be the technique of choice in the field of medical imaging. The high contrast is attained as a result in variations in signal intensity between various types of tissues. The image quality depends on various factors that include the scan time, spatial resolution and noise to signal ratio. Additionally, the unique characteristics of nuclear spins can affect the image quality. This paper explores the different factors affecting image quality as well as sources of MR signal and different weighting images. A detailed discussion on parameters which are necessary to maintain a high quality image will also be included. These parameters consist of spin density, relaxation properties, and magnetic field strength.
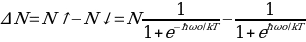
MR signal. Generally, in order for an atom to give rise to MR signal, it must have a charge as well as a spin. These vital properties are inherent of the nuclei, which obtain magnetic moments making it act as a small magnet. This is in line with the law of electromagnetism. The hydrogen is the atom that is of great interest in clinical MRI because of its natural abundance and capacity to give significant large magnetic moments. When there is no external, magnet field the individual magnet moments in the atoms are distributed randomly resulting in the reduction of the net magnetic field. The decrease in the net magnetic moment is inversely related to the total number of nuclei. This signifies that the higher the number of nuclei is, the lesser the net magnetic moment becomes. This is due to the fact that there is an increase in the counteraction between the nuclei. When an external magnetic field is introduced, the hydrogen nuclei align with the external magnetic field (Bo) with two possible orientations, parallel and anti-parallel. The orientation is determined by energy state of the protons with those having high energy assuming anti-parallel orientation. The following equation determines the number of orientations: No. of orientations = 2I+1 where (I) is the spin. In case of hydrogen, this is equal ½. As the norm of some nuclei will align parallel (spin up), and others will align anti-parallel (spin down), finally, they will cancel out each other. The net magnetization vector (NMV) is determined by the remaining nuclei in the low energy state. In clinical MRI, the factor that affects which nuclei align parallel (the low energy state) or anti-parallel (high-energy state) is the magnetic field strength. Hence, in a higher magnetic field strength, more hydrogen nuclei in the lower energy state will align with the main magnetic field (low energy state), and the NMV will be larger resulting in the detection of a high signal. To calculate the number of nuclei in the low and high energy state and, subsequently, the net magnetization vector (NMV), the law of Boltzmann distribution is required through its equation.
Where N is the nuclei number in a sample, h is Planck’s constant, w is the Larmor frequency of nuclei, K is the Boltzmann constant 1.38 × 10 = 23JK-1, and T is the temperature in Kelvin. The effect of the external magnetic field (B0) is not restricted on the alignment of the spins with the field. It has another effect, which involves creation of additional spin called precession when it tries to align the NMV with the field. The velocity at which the NMV moves about the external magnetic field (B0) is referred to as precessional frequency and calculated as follows:
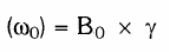
 the gyromagnetic ratio, w is the precessional (Larmour) frequency.
When an object is subjected to a RF pulse that has a frequency as the same as the precessional frequency of hydrogen nuclei and perpendicular to the B0, the nuclei will absorb energy from the RF pulse and start resonating. As a result, the number of nuclei in the higher state will increase as some nuclei in the lower energy state gained energy. This process is referred to as excitation. At high field strength, the energy to produce resonance is high due to the increase in the difference between the two energy states. Resonance has two possible consequences. The first one is that the net magnetization vector flips into the transverse plane (if it is 90 degrees RF pulse) and continue to precess in it at Larmour frequency (CD1, MRES7001). In this type of consequence, the slow and fast speeds are both aligned on a single line resulting to the highest signal. The second phase consequence is that the magnetic moments become in phase. These two consequences result in a voltage being induced in the receiver coil as a sinusoidal current (the receiver coil is only sensitive to the NMV in the transverse plane). This is in line to Faraday’s law which states that the change in the magnetic field induces an electric field. The induced voltage produces the MR signal and is dependant on the amount of the NMV in the transverse plane. This implies that more the magnetization in the transverse plane is, greater the signal is received. An application of 180 degrees RF pulse leads to the acquisition of MR signal as an echo (CD1, Modules 1 & 2).
The relaxation process
When the RF pulse is turned off, Bo attempts to realign the NMV with the field causing relaxation. This relaxation process occurs when the NMV releases its energy that is, then, absorbed by the RF pulse. The longitudinal magnetization is increased in the course of relaxation (spin lattice relaxation). This is also known as longitudinal recovery or T1 recovery (CD1, MRES7001). The transverse magnetization, on the other hand, decreases as it looses energy to the surrounding tissue resulting in the loss of phase coherence (spin- spin relaxation). This result in a process refers to as transverse decay or T2 decay. While transverse magnetization decreases, there is also a decrease in the current induced in the receiver coil (CD1, Modules 4, 5 & 6).
Image weighting
The contrast can be obtained by using three processes, T1, T2 and proton density. A large transverse magnetization gives a bright tissue on the MR image while a small transverse magnetization gives rise to a dark tissue on the image. The two main tissues in a human body are fat and water. Research states that fat contains short T1 because the tumbling of molecules is slow. The T1 is long in water because the mobility of molecules is relatively high, and hence they retain the transverse magnetization for relatively longer time. Similarly, T2 is short in fat, and this is because hydrogen nuclei exchange their energy in fat more efficiently. T2 is long in water as well because the exchange of energy is not as efficient as in the case in fat.
T1 weighted images
The NMV will flip into the transverse plane and continue to precess in phase after the application of 90 degrees RF pulse. The NMV will start to decay in the transverse plane and recover back to Bo when the RF is turned off. Fat has more longitudinal magnetization because the longitudinal recovery of fat is faster compared to that in water. More magnetization can be obtained in the transverse plane in fat after the application of the next RF pulse. This, therefore, will ensure that it is bight on the image. The time between the start of the RF pulse and the start of the next RF pulse is known as TR. It controls T1 recovery, and the longitudinal recovery of fat is faster compared to that of water. Therefore, using short TR ensures that there is a difference in contrast between fat and water while a long TR ensures full recovery for both fat and water. It is, however, worth noting that leaving long TR would give a high signal image, but not a bad contrast. There will not be significant differences between the pulses after the next RF pulse because they have the same amount of magnetization in the transverse plane. This is illustrated in the figure below:
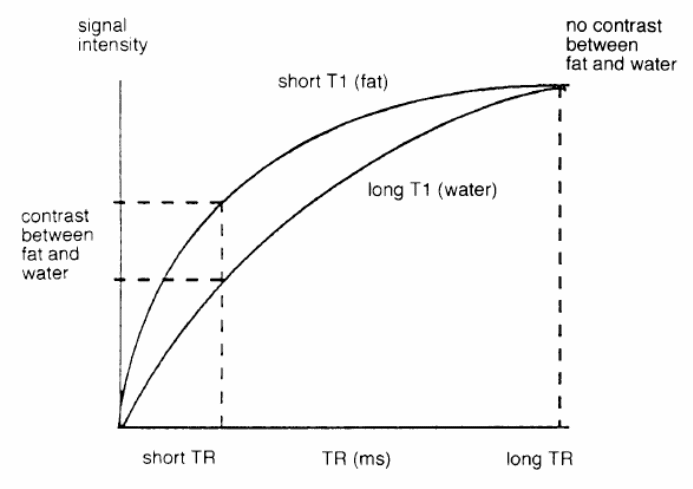
In the figure above, dealing with the longitudinal curve (T1) with short TR, the maximum contrast is obtained. Source: Catherine Westbrook & Kaut-Roth, C 2005, MRI in Pracise, 2rd edn, Wiley-Blackwell
T2 weighted images
It has been determined that fat decays very fast in the transverse plane which means that it has short T2. Water, on the other hand, retains the transverse magnetization for long time meaning that it has long T2. This implies that water will be bright on the image while fat is dark. TE refers to the time between the start of RF pulse and the centre of the echo. It controls the amount of magnetization in the transverse plane, and the use of long TR achieves T2 weighting. The two tissues have no enough time to decay if short TE is used, and therefore, they will have the same amount of magnetization in the transverse plane, as it is illustrated below.
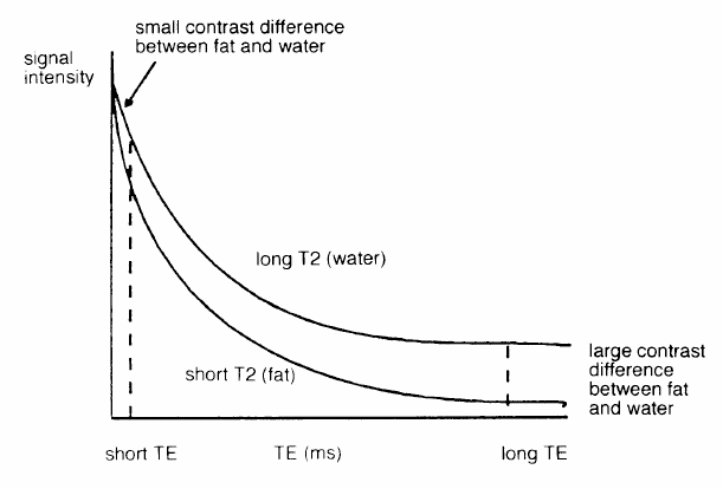
The figure illustrates that comprising between TR and TE can result in a good quality image that has a good contrast and high signal. However, high signal and contrast cannot be achieved simultaneously. In this type of decay, the phase coherence does not have the same time characteristics as the loss of phase coherence and consequently cannot be refocused by a 180 pulse (Westbrook & Roth 2005).
Proton density weighted images
Decay of T2*
The loss of phase coherence in the transverse plane is a mixture between T2 decay and the in-homogeneity in the external magnetic field. Hence, it occurs faster than T2 decay. The loss of transverse phase coherence and the loss of signal can be compensated for by the application of 180 degrees RF pulse (Zlatkin, 2003). This application ensures that T2 decay or incoherent dephasing is an irreversible loss of phase coherence (CD1, Module 4).
Image quality
This is determined by four factors signal to noise ratio, contrast, spatial resolution, and duration of the scan.
Signal to noise ratio (SNR)
A number of factors affect the amount of the signal, and these include proton density, Voxel size, TR, TE, the flip angle, number of excitations (NEX), and receiver bandwidth.
Proton density. Proton density is the number of protons in a sample. The more the protons the better the image signal is. The contrast difference is dependent on the number of protons in the tissues and the difference in T1 and T2 time in this type of imaging. Tissues with high spin density, such as the brain, have high signal and thus high SNR. Tissues with low spin density, such as the cortical bone, have a low signal and thus low SNR (CD1, MRES7001).
Voxel size. This is determined by a pixel size and the thickness of the slice. Increasing in the voxel size will cause the increase of the SNR. However, this does not mean that the quality of the image is high. On the other hand, if the voxel size is reduced, special resolution increases. Because large voxels can contain more than one tissue type, and therefore, the signal intensity will be averaged between them. Consequently, the spatial resolution will be low.
TR, TE and flip angle. These parameters do not only affect the contrast, they affect the SNR as well as the quality of the image. TR controls T1 relaxation process. If the TR is long, the magnetization will be allowed to be fully recovered and have more transverse magnetization from the next RF pulse. Thus, long TR gives high SNR. TE controls T2 relaxation process, if TR is short, the magnetization will not be allowed to decay in the transverse plane, and therefore, high current is induced in the receiver coil. Thus, short TE gives high SNR. Flip angle also affects SNR because in a spin echo pulse sequence, the RF pulse angle is usually 90 degrees which flips the whole NMV into the transverse plane and therefore gives high SNR. In a gradient pulse sequence, the flip angle used is less than 90 degrees RF pulse, and therefore, less magnetization will be flipped in the transverse plane and low SNR.
NEX. This method is not the preferred way to increase the SNR because those increases of signal are limited due to the random motion of noise, and that has a considerable effect on the scan time. However, this can help in reducing the motion artifact and therefore increasing the quality of the image.
Receive bandwidth. It is the frequency range that is sampled while the frequency gradient is applied. If the bandwidth is reduced, the noise will be reduced, and therefore the SNR will increase. However, this leads to an increase in chemical shift artifact. (Catherine Westbrook& Kaut-Roth 2005)
Contrast
This refers to the difference in signal intensity between two adjacent tissues. It is one of the most critical factors influencing the quality of the image. It depends on TR, TE, flip angle, T1 (inversion time), T1, T2 and proton density. The contrast between tissues, such as saturation and inversion recovery, can be increased. Most importantly, contrast and signal need to be compromised for good image quality. Inversion recovery is achieved by the application of 180 degrees RF pulse followed by 90 and 180 refocusing pulse. The method ensures that the best contrast between fat and water is obtained by exploiting the TI (Westbrook and Kaut-Roth, 2005).
Spatial resolution
Spatial resolution is determined by the size of the voxel. Large voxels cause low resolution while small voxels cause high resolution. Slice thickness, FOV, and number of pixels affect the size of the voxel. Decreasing the slice thickness will increase the spatial resolution. An increase in the number of pixels by increasing the size of the matrix causes a growth in the spatial resolution. Increment in the field of view (FOV) increases the size of the pixel and hence reduces the spatial resolution (Westbrook and Kaut-Roth, 2005).
Scan time
Increasing the scan time causes a growth in the chance of patient movement in the acquisition process. This reduces the image quality. According to Westbrook and Kaut-Roth, reducing the scan time requires that the TR, NEX and the number of phase encoding should be as low as possible (2005).
Conclusion
It is therefore evident that the quality of the image is greatly affected by a number of factors, namely SNR, contrast, and resolution. High SNR can result in poor image quality because of reduced ability to distinguish between different types of tissues. The operator, therefore, should always compromise between the SNR and contrast by changing certain parameters if high image quality is to be achieved.
References
Magnetic Resonance Imaging Course. CD1, modules 1, 2, 4, 5, 6. Brisbane, Australia: University of Queensland.
Westbook, C., Roth, C., & Tablot, J. 2005. MRI in Practice, New Jersey: Wiley-Blackwell.
Zlatkin, M. 2003. MRI of the shoulder. Philadelphia: Lippincott Williams & Wilkins.