Introduction
The differences between various English accents are a well-researched topic, particularly when it comes to the North American and British variations. The difference in how various groups pronounce words may be the most important point of discussion on the topic. It is the most overt difference between various modes of speaking for the same language, and so, people tend to notice it first. These different accents are perceived as a part of the culture, with one’s pronunciation being used to determine their upbringing. With regards to North American and British cultures, specifically, there exists a popular view of the latter accent as attractive. This research paper proposes the hypothesis that this attitude is the result of the lower pitch generally used by British speakers. It uses a production study based on ten different words to test the notion.
Background
Children begin learning languages at a young age, becoming able to speak their first words around the age of one. As such, Maclagan, Watson, Harlow, King, and Keegan (2009) note that preschool education is highly important and may even lead to the emergence of new language developments depending on the environment. Many people are surrounded by members of one culture throughout their upbringing and inherit their speaking patterns as a result. As Yang (2016) notes, once these habits settle in, they affect all aspects of speech and can even hinder one’s efforts to learn another language through the superimposition of their rules and conventions. As such, accents tend to remain static even if the person moves elsewhere and tries to adapt to different speaking patterns. The tendency to determine one’s culture based on their pronunciation has emerged from the recognition of this tendency.
The recognition of the British accent as sexually attractive may be associated with the general view of the nation’s culture as more traditional and focused on good appearances than that of the United States. However, Pisanski, Oleszkiewicz, Plachetka, Gmiterek, and Reby (2018) note that people tend to lower the pitch of their voice when speaking to a potential mate. Moreover, the preference of women for a lower pitch in men has been documented extensively in the past, but the study claims that the same is true for men. Harada (2007) provides the research method, using structurally and tonally similar sentences in two languages to compare the voice onset time of English and Japanese children. In this study, however, both groups speak English, and so it is possible to use the same sentence to create a more direct comparison.
Method
The study has collected test samples from six participants, two of whom are male while the other four are female. Their ages range between 10 and 16, and they are all school students. Five of the people who have submitted their voices speak with a North American accent, and the remaining female subject speaks with a British accent. All of the participants are friends and family of the researcher and have participated voluntarily at their request without material compensation. They have given their informed consent to being recorded after being informed of the concept of the study and its methods. The participants were separated into two groups based on their accent, with no other designations. There is one British accent speaker and five people with North American accents because only one person with the former was available.
The participants were given ten simple sentences to speak in front of a recorder. These sentences are as follows, with the capitalized words being of particular importance and the rest providing context:
- My mother cooks with BUTTER.
- She told us to have a MERRY Christmas.
- That girl is an INTERNATIONAL student.
- James asked her to MARRY him.
- His sister broke my BUTTON.
- My dream is to live in MANHATTAN.
- The girl is from BOSTON.
- I WANTED to buy a dog.
- The floor was made out of METAL
- My sister won a MEDAL.
An iPhone device’s internal microphone was used for the purpose, with no set environment beyond the requirement for lack of noise. After the recording process was complete, the words in question were cut out and analyzed using the “Praat” (n.d.) software. It should be noted that the data for one of the male participants’ first four sentences was corrupted and thus unusable. In particular, their frequency and pitch underwent analysis and comparison. The results of the observations are provided below, along with an analysis and discussion.
Results
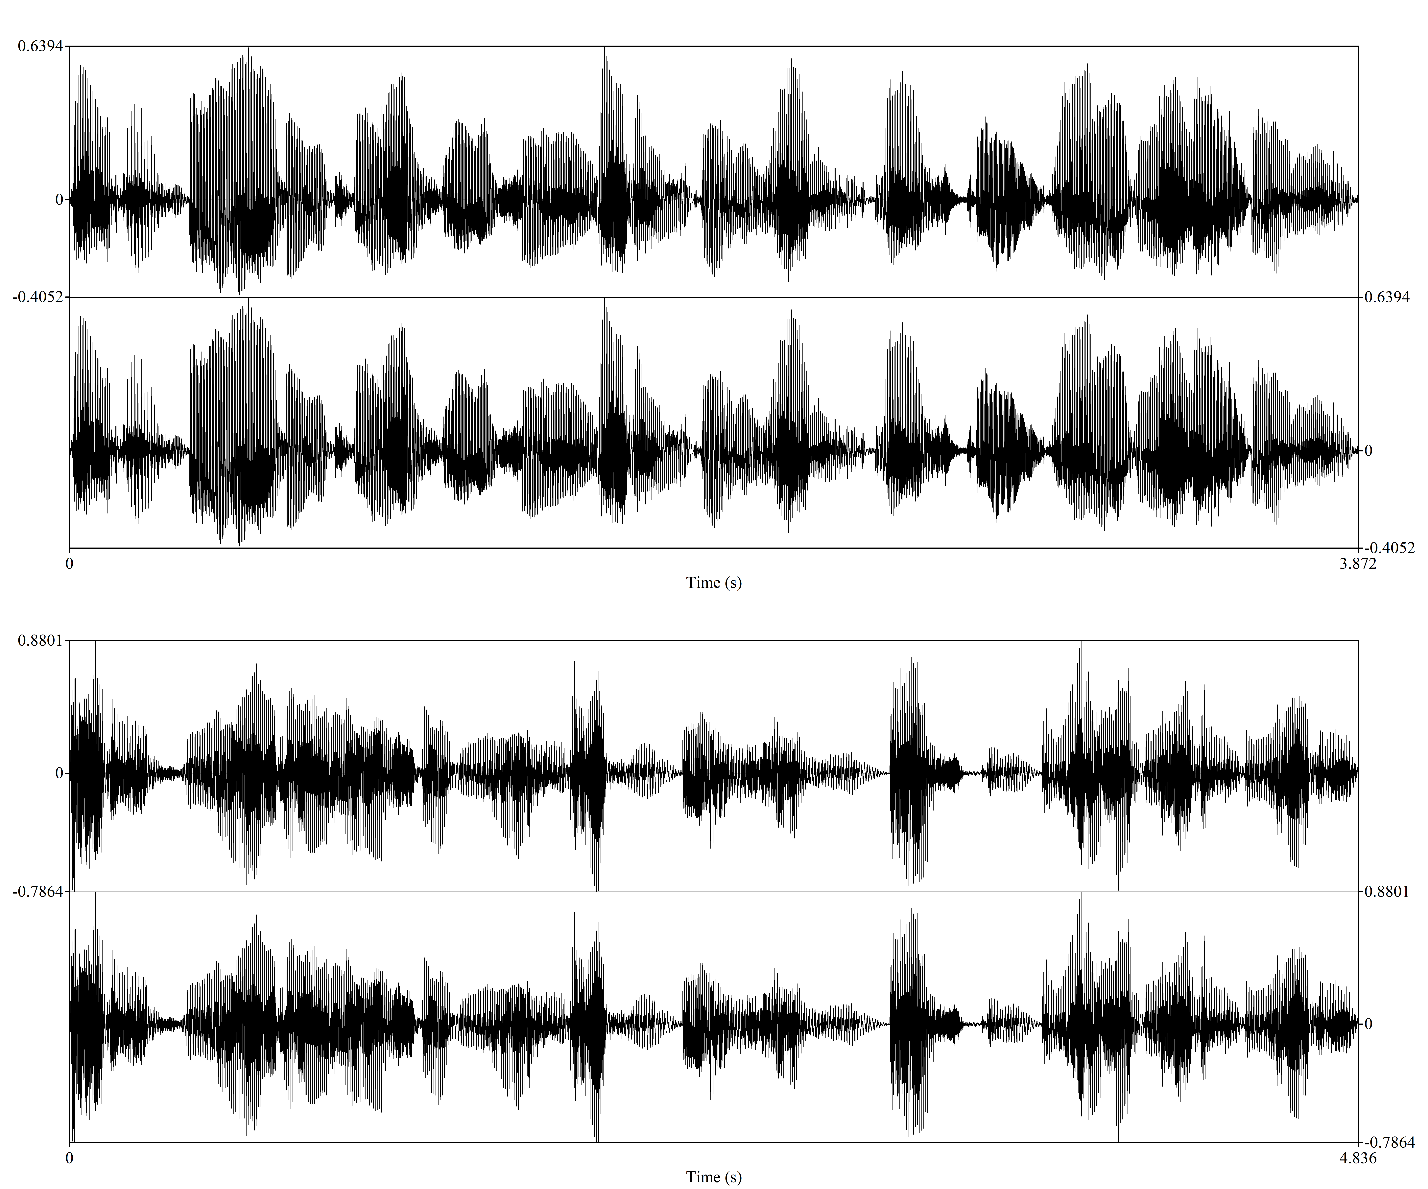
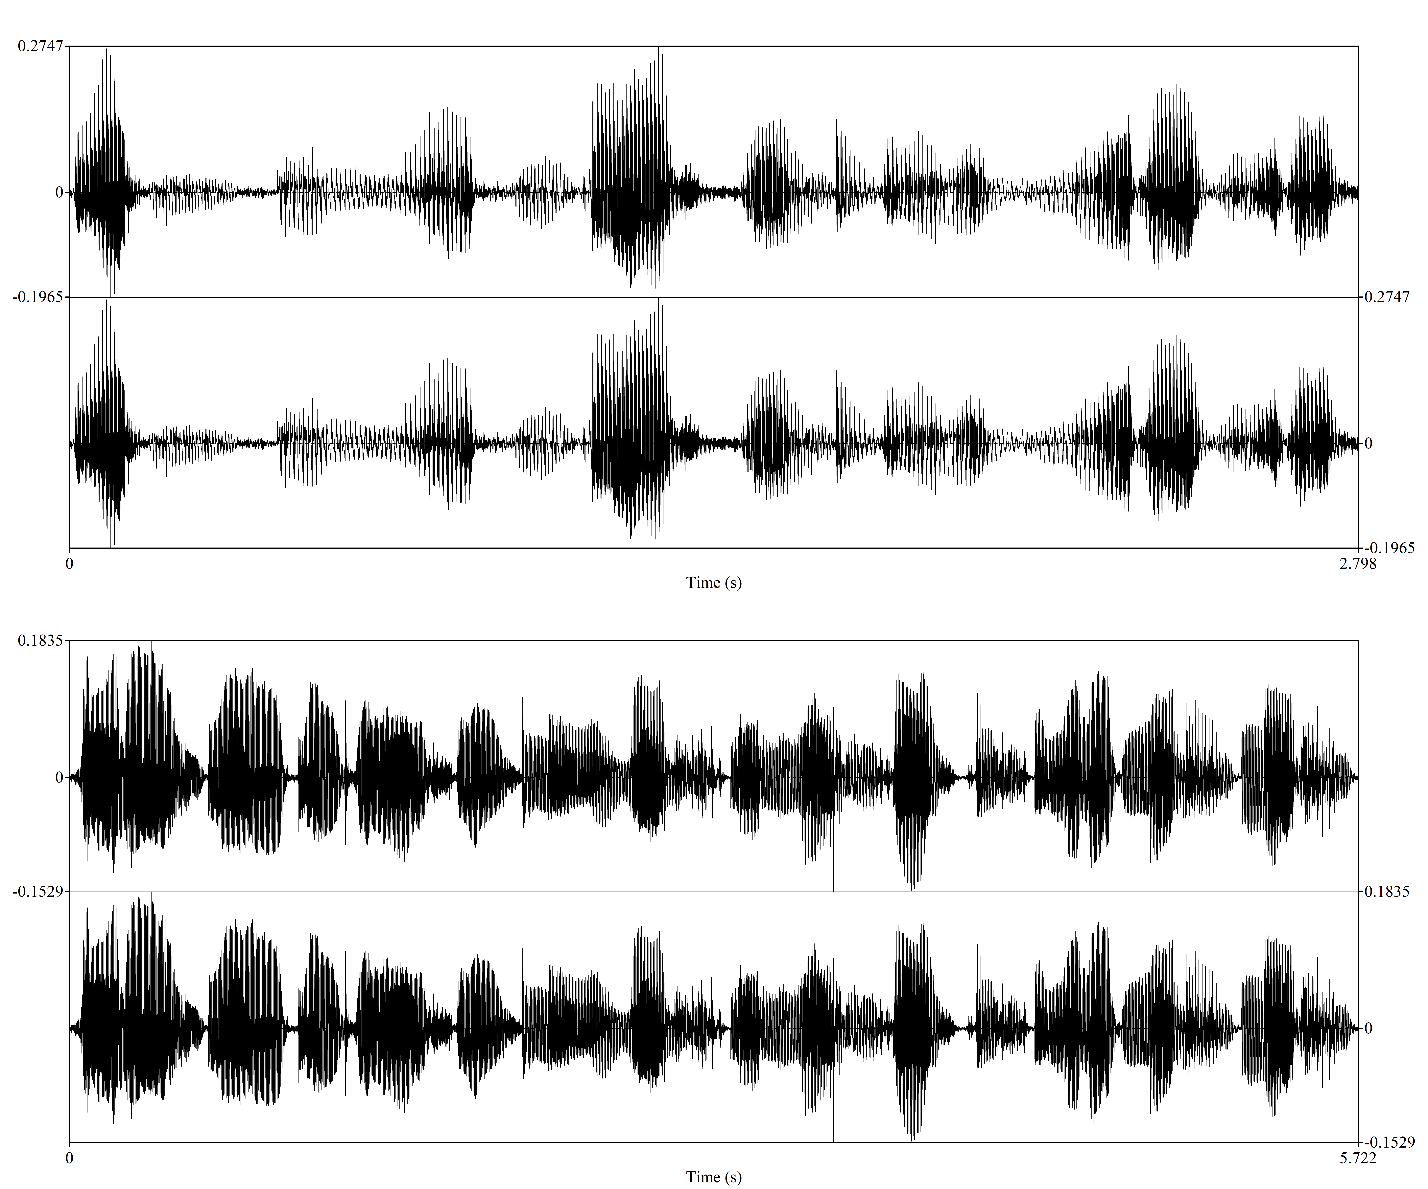
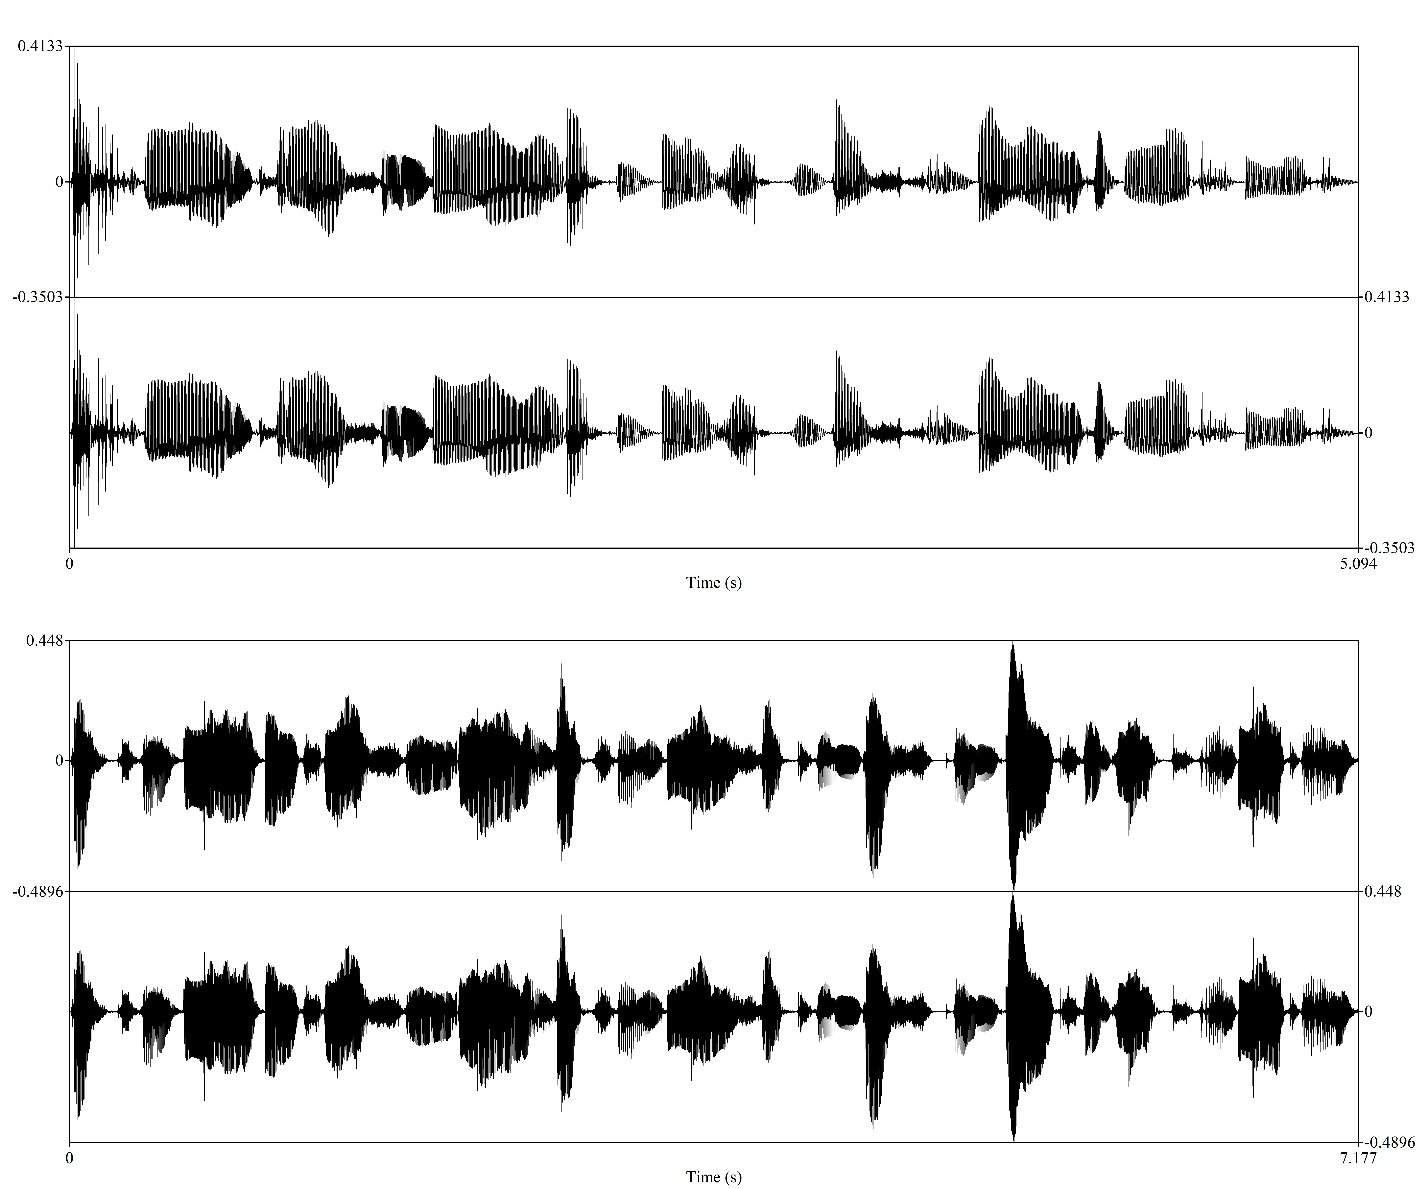
The amplitude graphs of all six participants’ pronunciations of the words are generally similar, though some individual differences result from specific quirks. The lengths of American 1 (2019), American 2 (2019), American 3 (2019), American 4 (2019), American 5 (2019), and English (2019) vary considerably due to their speech speeds, but when normalized to the same length, the graphs appear similar. The third graph is different from the rest due to the reasons outlined above, and the technical limitations of the application used disallow normalization that would shorten the graph correspondingly. Their maximum amplitudes tend to be close, as shown in figures 1, 2, and 3, which indicates that they generally spoke at the same volume. The confirmation is beneficial for the next section, which contains the spectrum analysis of the recordings.
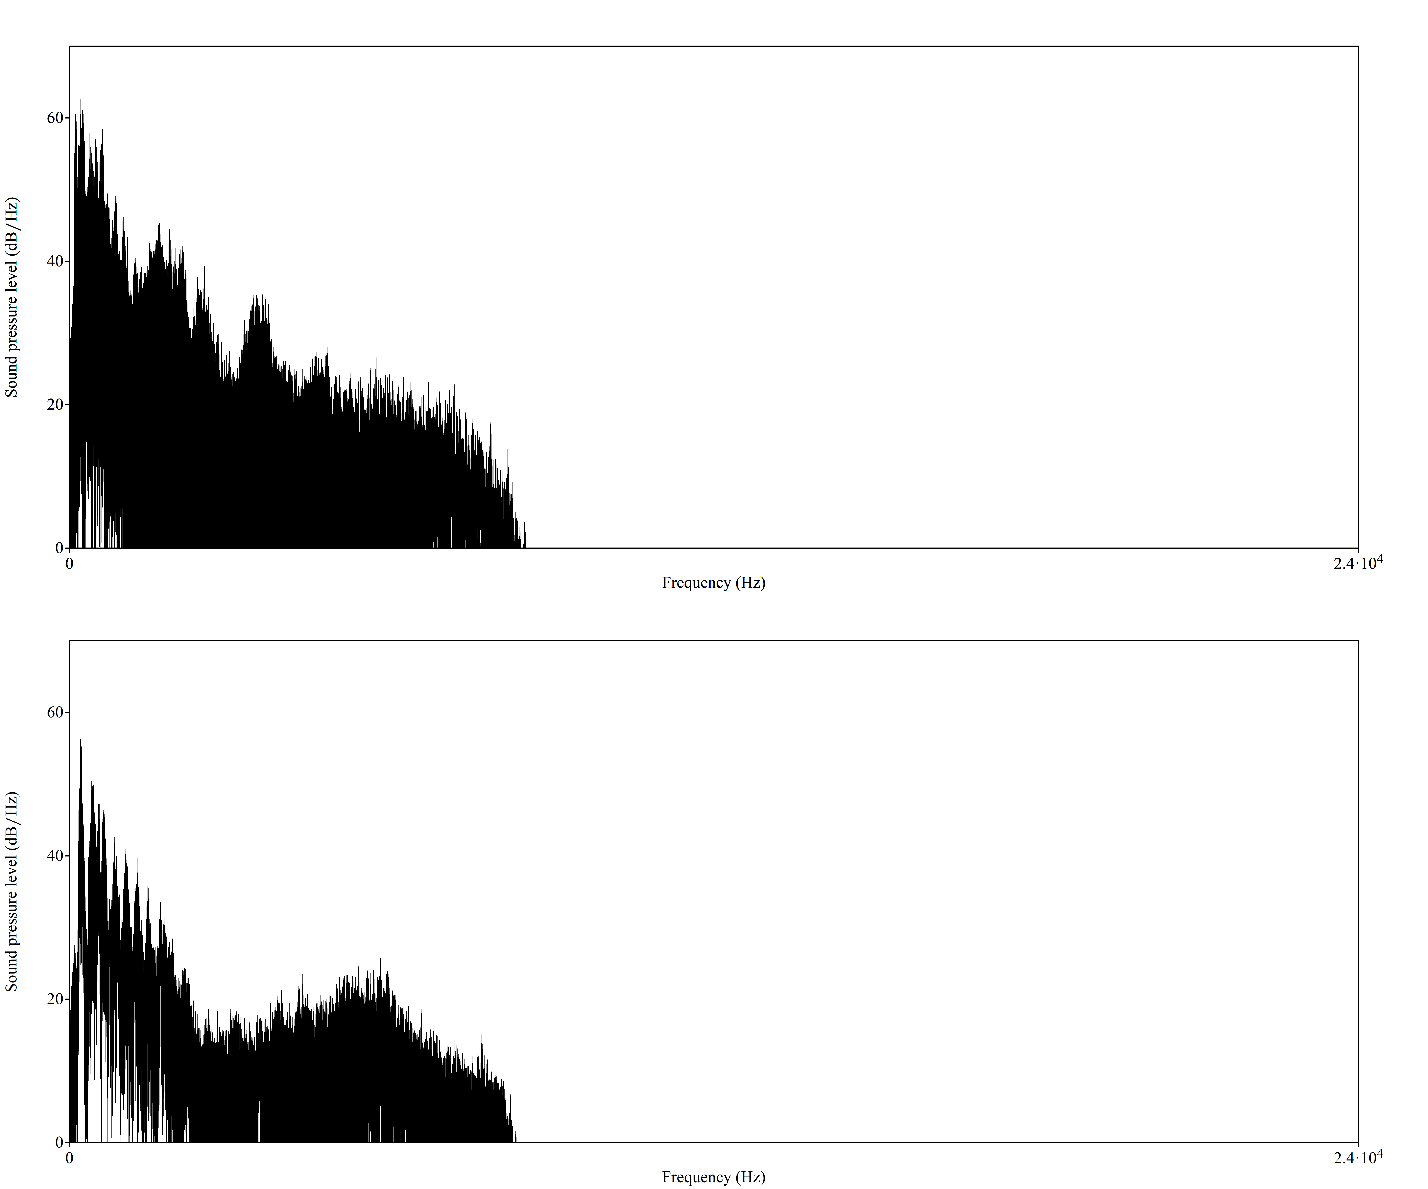
The observation is represented by figure 4, with the first graph in it representing the combination of the recordings by the North American accent group and the second featuring the sole participant with a British accent. The vertical axis is the sound pressure level, which is representative of volume, and the horizontal one is the frequency. As can be seen, the second graph’s values are lower than the first’s in general, but the effect is minor at low frequencies and increases along with their growth. There is an outlier near the top end, where the values of the two graphs nearly match each other, but afterward, the second graph declines much faster than the first. The differences mean that the British person pronounces lower-pitched sounds at mostly the same volumes but is significantly quieter than the North Americans with higher pitches.
Discussion
Overall, the result appears to support the hypothesis of the study, with the British person emphasizing lower sounds more than high ones. As such, they would be unconsciously perceived as more attractive by North Americans, who speak at higher pitches and are not used to the European variation, as per Pisanski et al. (2018). The participants are not adults, being in various stages of adolescence, but display easily recognizable differences, which is consistent with Maclagan et al. (2009) claim that early experiences are critical. Moreover, even though the British person currently resides in the United States, she speaks with an apparent accent, confirming Yang’s (2016) assertion. Harada’s (2007) similar claim that immersion does not help people reach native-like pronunciation. The study confirms much of the information provided in the literature, with few to no outlying results.
However, it should be noted that the study has numerous limitations, such as the depth of the analysis and the size of the sample. Six people are not an adequate sample to make determinations confidently. Moreover, the fact that there is only one participant in one of the groups has the potential of introducing significant biases and precludes analysis based on the genders of the participants. Some of the British participant’s speech patterns may be informed by their gender’s biological and social attributes. A more extensive sample of sentences and words would also be beneficial, as there were several mispronunciations in the original sample that may have affected the overall flow of their sentences and introduced errors. Overall, the results provide a noteworthy supposition but cannot serve as strong scientific evidence for the hypothesis.
Conclusion
Overall, the results of the study confirm the hypothesis that the British accent features pronunciation that emphasizes lower tones. The participant that formed the group showed a significantly lower usage of high-pitched vocalizations than the North American study subjects. However, numerous limitations preclude the results from possessing significant importance. A larger sample with a more extensive recording would be beneficial to improve the accuracy and validity of the results. Further research that would compare more different accents, such as the Australian one, the New Zealand one, and possibly various accents of people who learn English as a second language, would also help provide a complete picture of the situation. Overall, the study provides an area of inquiry for future researchers, as it is inadequate for answering the question.
Appendices
References
Harada, T. (2007). The production of voice onset time (VOT) by English-speaking children in a Japanese immersion program. IRAL-International Review of Applied Linguistics in Language Teaching, 45(4), 353-378.
Maclagan, M., Watson, C. I., Harlow, R., King, J., & Keegan, P. (2009). /u/ fronting and /t/ aspiration in Māori and New Zealand English. Language Variation and Change, 21(2), 175-192.
Pisanski, K., Oleszkiewicz, A., Plachetka, J., Gmiterek, M., & Reby, D. (2018). Voice pitch modulation in human mate choice. Proceedings of the Royal Society B, 285.
Praat: Doing phonetics by computer. (n.d.).
Yang, C. (2016). Tone errors in scripted conversations of L2 Mandarin Chinese. Chinese as a Second Language Research, 5(1), 63-86.