Introduction
The PDA Forio Simulation is intentioned to evaluate and assess the capability of a strategic decision make to formulate diverse strategies and dynamically adjust strategies as a consequent of market responds to price and quality constraints. With the ever increasing dynamics of competition in the international and local markets, organizations are is constant state of quality improvement through research and development and price adjustments in an attempt to achieve competitive edge, in this case an optimal mixture of the constrains aids the organization to attain strategic objectives in terms of customer attraction, customer satisfaction and loyalty in terms of existing customers while controlling costs and maximizing profitability.
In the report, three products offered by PDA Sim Company (Handheld X5, Handheld X6 and Handheld X7) were the subjects of analysis, with the core objective of maximizing profits by influencing the sale of its commodities by trenchant new markets and implementing the correct pricing strategy to consider achieving greater long term profitability by use of a simulation software as presented by Grassley, (2004). The report offers in-depth analyses as regards the consequences of research and development costs on the adopted strategies. The report further offers proposals on substitute strategies to be adopted by the organization so as to achieve capitalize on long term objectives.
Product Review
The company boasts of three products in the market as at the beginning of the year 2006, Handheld X5, Handheld X6 and Handheld X7, the products are at different stages of the product cycle, having been introduced at different times. Handheld X5 (Plastic case)which has been in the market for three years, have customers confidence in terms of performance and has positive market response, while it is approaching it is approaching maturity stage of a product-life cycle, exhibited by the increments in the number of repeat customers in correlation with new customers. Handheld X6 (Flat metal case), has been in the market for two years and customers are concerned about performance, is at the shakeout stage of the product-life cycle with new customers or repeat customers, Handheld X7 Colored case, is constrained by both performance and price having been in the market for one year, at the growth stage and boasting of new customers. According to Proctor, (2000), the pricing and research and development strategies implemented by an organization are a consequent of the product-life cycle for every product as presented below.
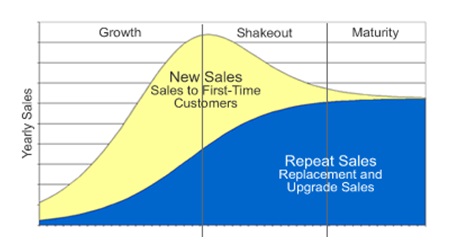
The growth stage of the product-life cycle has a concentration of first-time customers, at the shakeout stage emergence of repeat sales is evident with the decline of new sales, and the maturity staged is portrayed by highest concentration of repeat sales Greasley, (2004).
Financial and market review for each product
Handheld X 5
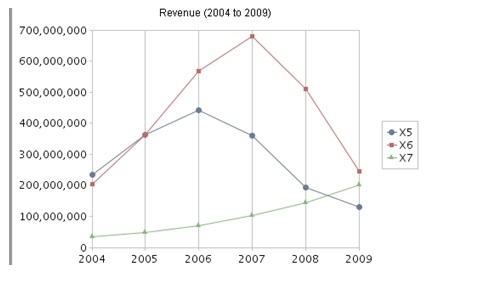
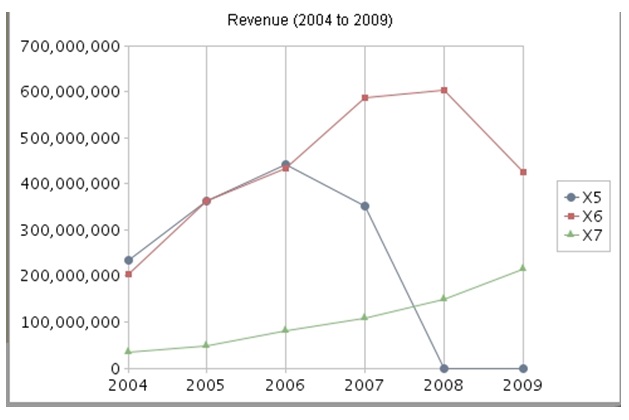
The product exhibited a constant pricing and research and development strategy; however it exhibited a positive revenue increment, from 362,007,649 to 441,554,008 was in the growth phase of the product lifecycle. , in the year 2006, in the year 2007, the revenue reduced to 359,902,259 the negative growth was further highlighted in the year 2008, when the revenue dropped to 191,537,306, and by 2009, the revenue as at its lowest in the four years of 129,047,041
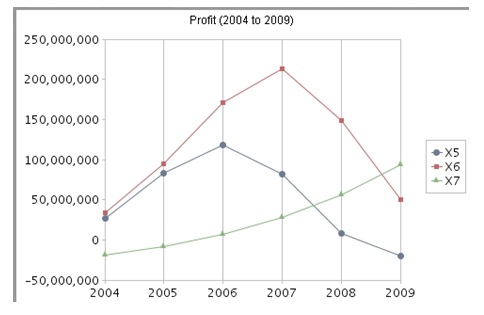
In terms of sales, there was a positive growth from 1,448,031, to 1,766,216, in the year 2006, however, in the year 2007, the sales reduced to 1,439,609, the reducing sales volume was further highlighted in the year 2008, when the sales dropped to 766,149, and by 2009, the sales was at its lowest in the four years of 516,188. The product has relatively stable performance. The profit chart tends to portray direct relation to sales where there was a positive growth from 82,616,699 to 117,617,097, in the year 2006, however, in the year 2007, the profit reduced to 81,690,327, year 2008 exhibited reduced profit since it was a reduced profit venture of 7,609,748, in the year 2009, when a loss of 19,885,968, was recorded.
Handheld X 6
While keeping the prices and research and development for the product constant in the entire period, however it exhibited a positive revenue increment, from 363,450,944 to 567,952,693 and priced about the same as products similar to it, in the year 2006, in the year 2007, the revenue peaked and expanded to 680,057,635, however, in the year 2008 the revenue dropped to 509,436,533, and by 2009, the revenue as at its lowest in the four years of 245,255,368.
In terms of sales, there was a positive growth from 908,627, to 1,419,882, in the year 2006, in the year 2007, the sales increased to 1,700,144, the negative sales volume was highlighted in the year 2008, when the sales dropped to 1,273,591, and by 2009, the sales was at its lowest in the four years of 613,138. The product has relatively stable performance. The profit chart tends to portray direct relation to sales where there was a positive growth from 94,425,417 to 171,113,573 in the year 2006, in the year 2007, the profit increased to 213,152,926, year 2008 exhibited reducing profit of 149,170,013, which tend to approach zero in the year 2009 at 50,102,076.
Handheld X 7
The product experienced a constant positive growth in revenue in the entire period while keeping the prices and research and development for the product constant, it showed a positive revenue increment, to 70,991,445 from 48,848,773
, the product is holding steady relative to the competition. , in the year 2006, in the year 2007, the revenue expanded to 102,124,915, further growing to 144,749,566 in the year 2008 and by 2009, the revenue peaked at 200,828,941
The sales volume was directly related with the revenue, where there was a constant positive growth in sales in the entire period, it showed a positive sales increment, from244, 244 to 354,957, in the year 2006, in the year 2007, the sales expanded to 510,625, further growing to 723,748 in the year 2008 and by 2009, the sales peaked at 1,004,145. The profit chart tends to portray direct relation to sales and revenue where there was a constant positive growth in profits in the entire period, it showed a positive profit increment, from a loss of -8,491,725 to a profit of 6,454,579 in the year 2006, in the year 2007, the profits expanded to 27,469,671, further growing to 56,241,310 in the year 2008 and by 2009, the profits peaked at 94,094,889.
From the analysis above, the company netted a final Total Score of $1,165,110,357.
Proposed Alternative Strategy
Implementing a combination of pricing strategies and manipulation of research and development costs, final Total Score of 1,340,175,105 can be achieved, whereas the final score is higher than the previous score, there is still space and potential for improvements considering consumer preferences for quality and price as presented by Gilligan & Richard, (2005). In this case diverse strategies were used in the PDA Simulation where for handheld X5 the paramount strategy is to take full advantage of short-term profit considering that that the product has been in the market for three years and the market is mature as argued by Allen, (2008), The price was $ 250 and 25 % R& D in 2006, was $ 250 and 25 % R& D in 2007 and the product discontinued in the subsequent years.
The strategy for Handheld X6 is to assign high prices for this product considering that it is being purchased for its exceptional performance, quality, and attractive appearance, while increasing R&D percentage in the following manner, The price was $ 450 and 50 % R& D in 2006, $ 450 and 50 % R& D in 2007, $ 450 and 50 % R& D in 2008 and $ 450 and 40 % R& D in 2009. With Handheld X7 the strategy is to lower the price considering its short duration in the market in agreement with Harrington & Tumay, (2000), while increasing R&D in the following manner, The price was $ 180 and 25 % R& D in 2006, $ 200 and 25 % R& D in 2007, $ 200 and 50 % R& D in 2008 and $ 200 and 60 % R& D in 2009, this gives a final score of 1,340,175,105, this is graphically presented by the charts below.
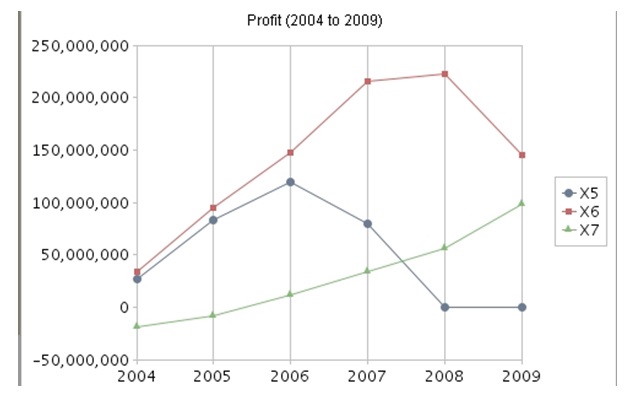
The difference between the score and Joe Schmoe’s score was that Joe Schmoe continued producing Product X5 in the year 2008 and 2009; while in this case, it was discontinued since it could result to losses, moreover, in the proposed case, the Research and development funds and prices were altered to suit the prevailing market conditions hence maximizing the profits.
References
Allen, S. (2008). The emergence of the relationship economy: The new order of things to come. Cupertino: Happy About press.
Gilligan ,C., & Richard M. (2005). Strategic marketing management: planning, implementation and control. Burlington: Butterworth-Heinemann.
Grassley, A. (2004). Simulation modeling for business. Burlington: Ashgate Publishing, Ltd.
Harrington, H. J., & Tumay, K. (2000). Simulation modeling methods. New York: McGraw-Hill Professional.
Proctor, T. (2000). Strategic marketing: an introduction. London: Routledge.