Introduction
Standing waves are produced when identical waves occur on the same medium. The waves travel in the opposite direction but have the same amplitude and wavelength. Usually, standing waves are best produced by connecting a string to a vibrating body on one end and a reflecting body on the other end (Xun-Jie & Tien, 2018). Conventionally, newly generated waves interface with the reflected ones. Under the suitable condition, a standing wave is formed.
A standing wave may contain many vibration modes, also called standing waves. The string may vibrate in single or multiple segments. Vibration in a single segment means the vibration occurs in only one-half of the string. In this case, the other end is used for reflection. When the string is vibrated at both ends, the vibrating ends are also used for reflection. A string may vibrate in two parts. In this case, a node is placed in the middle of the strong. The resultant wavelength is the same as the length of the string.
In any case, the wavelength is longer than the length of the string. If a string is connected to two fixed endpoints, it is said to be constrained at those points. The points are hence referred to as nodes. As mentioned above, the wave is reflected at the non-vibrating node. It means reflection occurs at half the wavelength, and therefore, the length of the string should be half the wavelength. The maximum amplitude of the standing wave can be found right at the anti-node, which is a point between the nodes. The figure below illustrates the formation of standing waves from two waves traveling in the opposite direction.
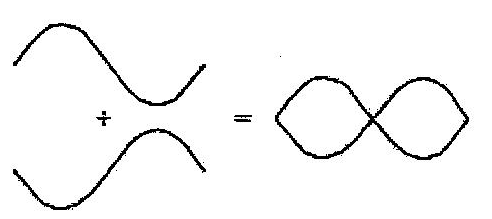
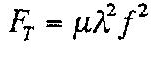
The waves are identical in frequency and wavelength. When merged under the right conditions, a standing wave is formed. The velocity of the wave traveling along a string is given by:
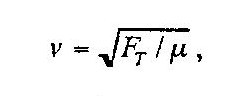
- μ and F T are properties of the string.
- μ represents the linear density
- FT represents tension
Consider the case where the wave travels to the right, then the velocity of the standing wave will be given by:
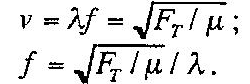
Fundamentally, when linear density and tension are constants, the frequency of that particular string will be given by:
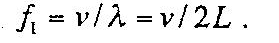
L is the length of the string.
The fundamental frequency is 1⁄2 λ, implying λ is equivalent to 2L. Any other possible frequency would be a multiple of λ.
To establish the linear mass density μ, use the formula below:
Apparatus and Procedure
To carry out this experiment, the following apparatus will be needed:
- A mechanical vibrator
- Universal table clamp
- Pulley
- Support rod
- Meter stick
- Digital function generator
- Hooker mass (200g or 500 grams)
- Two different strings
- Electronic balance
The experiment is carried out as follows:
- Measure the mass of a 2.5 m string when stretched. Calculate the mass and linear density using the formula provided in the discussions above.
- Tie one end of the string to the mechanical vibrator, as shown in the figure below(citation). Tie the 500g mass on the other end and place it on the pulley as shown. Measure the length of the string. Record all measurements as required in table 1 below.
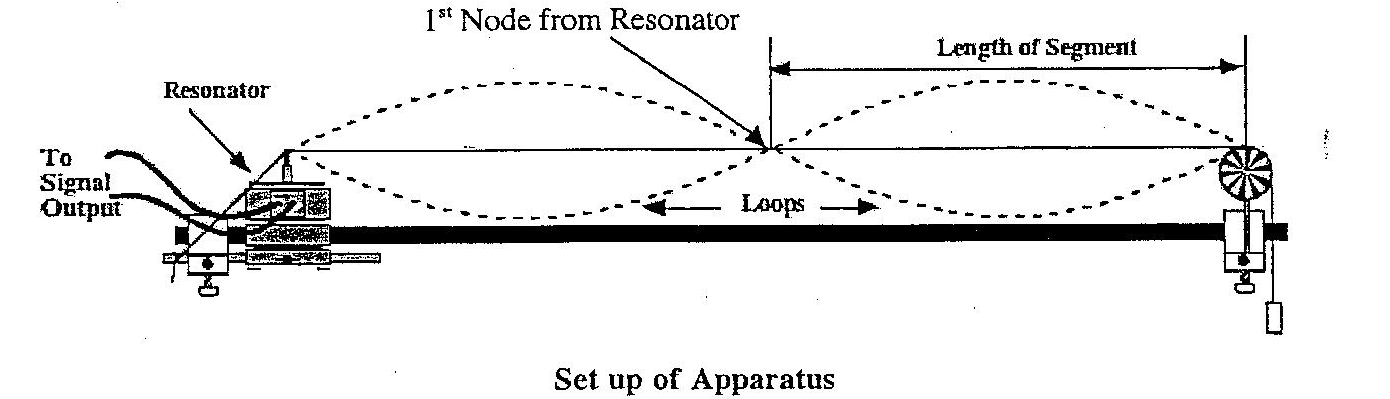
- Power the generator at 10Hz. Alter the frequency until a standing wave pattern is established. Use the knob to adjust the frequency. In case a standing wave is established, but the maximum amplitude is not achieved, adjust the distance between the pulley and the resonator as required.
- Record the physical distance between the pulley and resonator. As mentioned in the discussions, one segment of the standing wave is equivalent to 1/2 λ. Likewise, calculate the experimental tension. Establish the percentage difference between the theoretical tension value and the experimental tension.
- Record your results in the table below.
- Record the result for the 2, 3, 4, and 5 harmonics and fill the results in the table.
- Repeat the experiment using a different string and record all values as in the case above.
Data Observations
Length of string
Case A (Low Tension)
Speed of the wave
Case B (Medium Tension)
Speed of the wave
Case C (High tension)
Speed of the wave
Data Analysis and Calculations
The measurement was obtained at different frequencies, and results were recorded in tables 1 and 2 above. The resultant calculations are also recorded in the respective tables. The variation in the values was achieved through the adjustment of frequencies and the length of the string. The measurements were only taken after a standing wave was observed. As a result, the calculation is based on the different values obtained from the experiment.
Conclusion
Based on the results, it is possible to establish the linearity of the results from the respective tables. Velocity is a factor of λ and frequency. The number of harmonic is also dependent on the frequency of the resonator. As discussed earlier. The number of standing waves is dependent on the frequency of the resonator and the length of the string. The linear density of the string also affects the number of standing waves formed (Xun-Jie & Tien, 2018).
References
Xun-Jie, K., & Tien, W. H. (2018) Particle Aggregation and Flow Patterns Induced by Ultrasonic Standing Wave and Acoustic Streaming. University National Taiwan University of Science and Technology.