Executive Summary
This paper supplies the results of a descriptive statistical analysis of data related to 71 best-selling brands of beer in the U.S. in 2007. The data is comprised of information about alcohol percentage, the number of calories, and the number of carbohydrates (in grams) per 12 ounces of beer. The main descriptives (means, including 95% confidence intervals; medians; variances; standard deviations; ranges; values of skewness; and values of kurtosis), as well as the results of normality tests for these variables, are reported. Also, histograms (with normal curves) and box-and-whiskers plots are included. All the tables and charts can be found in appendices.
Quantitative Methods Midterm
This paper provides the results of a statistical analysis of data about 71 most popular domestic beer in the U.S. This data was originally taken from “Beer Brewpub” (n.d.) on May 4, 2007. The data includes information about alcohol percentage in beer, as well as the number of calories for every 12 ounces of beer, and the number of carbohydrates (in grams) per 12 ounces of beer. Relevant descriptive statistics, as well as normality tests, histograms, and box-and-whisker plots, are supplied.
Methods Used
To analyze the data, IBM SPSS Statistics v. 23 software was utilized. To calculate descriptive statistics and normality tests, and to create box-and-whisker plots, the Analyze → Descriptive statistics → Explore procedure was used; consequently, the means, variances, and standard deviations are calculated according to the formulae that estimate the respective population parameters from the given sample (Warner, 2013). For histograms, the procedure Graphs → Legacy dialogs → Histogram was employed to obtain histograms with normal curves (George & Mallery, 2016).
Analysis
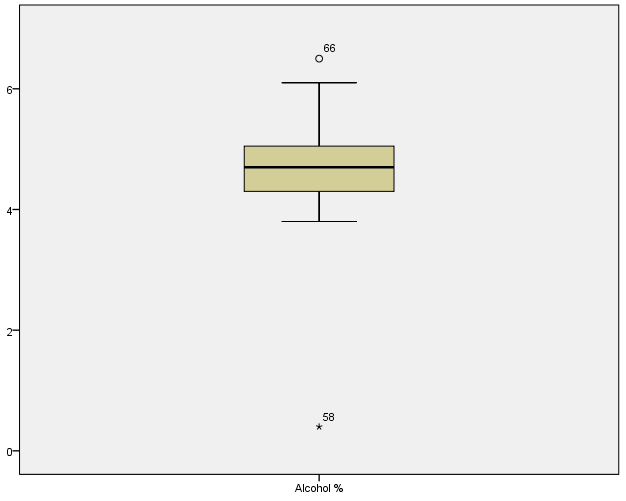
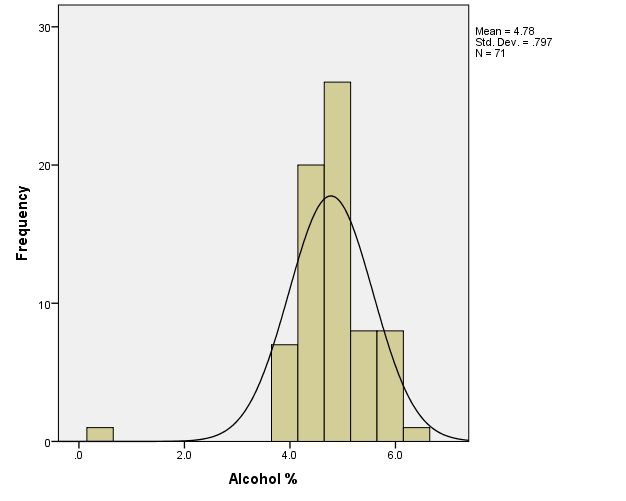
The results for Alcohol Percentage are as follows. It is easy to see from Appendix 1 that for Alcohol Percentage, Mean=4.776 (95% CI: 4.587-4.965); Median=4.7; Variance=.635; SD=.797; Range=6.1. Also, Skewness=-2.01 (skewed to the right), Kurtosis=12.079 (most values are close to the mean). From the histogram (Appendix 2), it is unclear whether the distribution is normal, but, as Appendix 3 shows, both Kolmogorov-Smirnov and Shapiro-Wilk tests are statistically significant at p<.001, suggesting that the data is not normally distributed. The box-and-whiskers chart (Appendix 4) displays that there is one significant outlier: case 66, “Red Hook IPA,” alcohol=6.5%; and one extreme outlier: case 58, “O’Doul’s,” alcohol=.4% (Field, 2013).
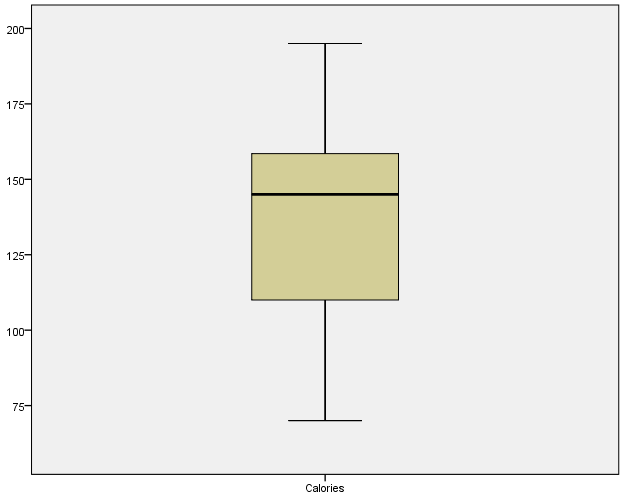
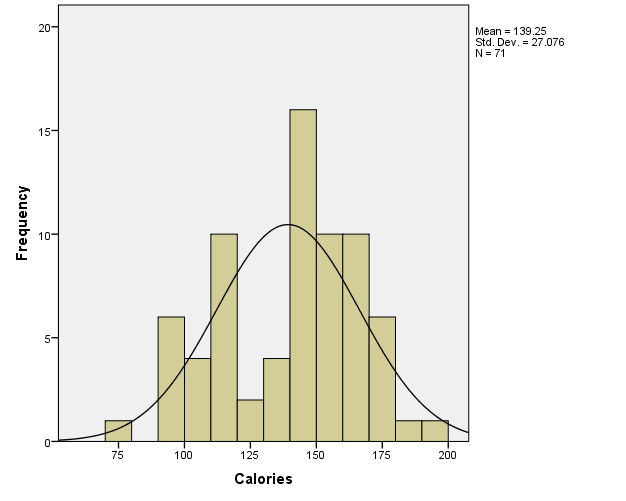
The results for Calories are described next. From Appendix 1, it can be seen that for Calories, Mean=139.25 (95% CI: 132.84-145.66); Median=145.0; Variance=733.135; SD=27.076; Range=125. Also, Skewness=-.364 (slightly skewed to the right); Kurtosis=-.664 (many values are not very close to the mean). From the histogram (Appendix 2), it is unclear whether the distribution is normal, but, as Appendix 3 shows, both Kolmogorov-Smirnov and Shapiro-Wilk tests are statistically significant (p<.001 and p=.010, respectively), indicating that the data is not normally distributed. The box-and-whiskers chart (Appendix 4) suggests that there are no significant outliers.
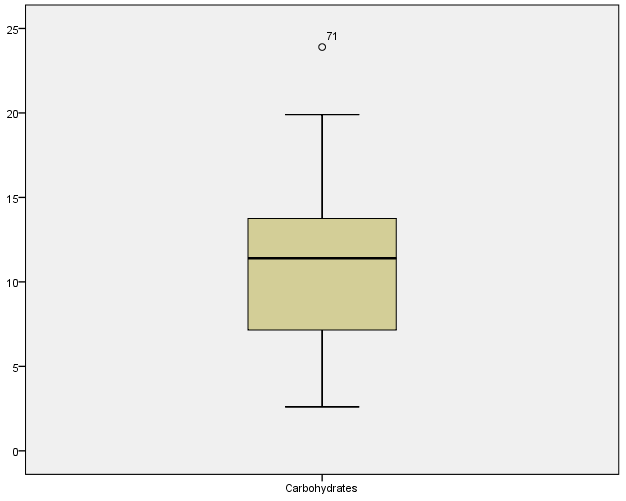
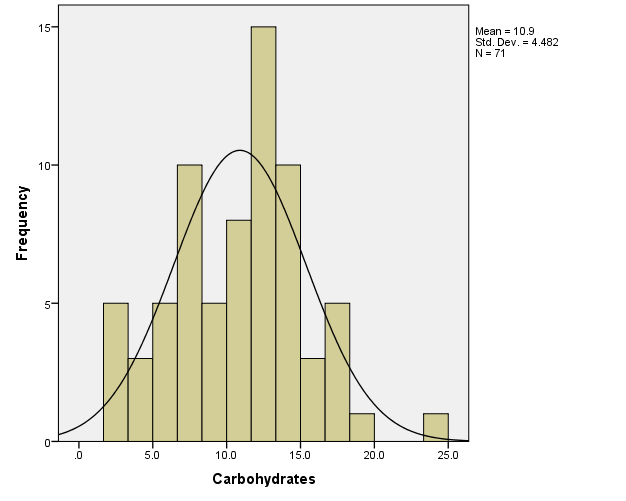
Finally, the results for Carbohydrates are as follows. From Appendix 1, it is evident that for Carbohydrates, Mean=10.896 (95% CI: 9.835-11.957); Median=11.4; Variance=20.09; SD=4.4822; Range=21.3. Also, Skewness=.122 (slightly skewed to the left); Kurtosis=-.101 (several values are not very close to the mean). From the histogram (Appendix 2), it might be assumed that the data is approximately normally distributed. Indeed, as Appendix 3 displays, both Kolmogorov-Smirnov and Shapiro-Wilk tests are non-significant (p=.200 and p=.266, respectively), which confirms that the data is approximately normally distributed. The box-and-whiskers chart (Appendix 4) allows for concluding that there is one significant outlier (Field, 2013): case 71, “Sam Adams Cream Stout,” carbohydrates=23.9.
Conclusion
On the whole, it should be stressed that IBM SPSS Statistics v. 23 software was used to calculate the relevant descriptive statistics and create the main charts for the data about 71 most popular types of beer in the U.S. The paper reports the results of the analysis which was conducted for this purpose.
References
Beer brewpub and microbrewery guide by beer 100. (n.d.). Web.
Field, A. (2013). Discovering statistics using IBM SPSS Statistics (4th ed.). Thousand Oaks, CA: SAGE Publications.
George, D., & Mallery, P. (2016). IBM SPSS Statistics 23 step by step: A simple guide and reference (14th ed.). New York, NY: Routledge.
Warner, R. M. (2013). Applied statistics: From bivariate through multivariate techniques (2nd ed.). Thousand Oaks, CA: SAGE Publications.
Appendices
Appendix 1
The descriptives for the data are as follows:
Appendix 2
The histograms for the given variables are as follows:
Appendix 3
The tests of normality for the three given variables are as follows:
Appendix 4
The box-and-whiskers charts for the three variables are as follows: