Introduction
Crude acid phosphatase, an enzyme, is vital in speeding up biological reactions, and as such, it comes in handy in the manufacture of proteins as well as the conversion of sugar compounds into usable sugar substrates. The enzyme phosphatase is an ubiquitous acid found in both plants and animal. The germ of the wheat seed is dominated by this enzyme and as such provides an all-important plant source. On the other hand, in animals and in particular humans, the prostate glands form the all-important source of this enzyme. From the wheat germ, it is possible to extract a crude product of this enzyme via pulping process in its aqueous state. The aqueous extract can be converted to powdered extract courtesy of a spray drier at low temperatures (Chang 2005). In this form they can conveniently be commercialized for laboratory use.
The enzyme phosphatase can be distinguished in the sense that it is non-specific in nature. To this end, it can act on a variety of esterase phosphate esters. This enzyme exists in three isomers designated as I, II and III. The enzyme functions, optimally, at a pH of 5. In plants, it is vital in enhancing the availability of inorganic phosphates that aid in the growth of seedlings. In details, whatever happens is that sugars in wheat are normally stored as compounds containing phosphates. To make the sugars useful in plants, there is need to break the sugar compound into its constituents- sugars and phosphates. The enzyme phosphatase enhances this by catalyzing this dissociation. Once dissociated, the sugars are hydrolyzed to provide the all-important energy that aid in the running of the biological processes. On the other hand, the phosphates form the building blocks vital for protein synthesis. Of note, in humans, clinical doctors use serum concentration of this enzyme as an indicator vital in the diagnosis of prostate cancer.
The objective of writing this report is to study the enzyme kinematics using the aforementioned enzyme. As such, the compound disodium p-nitrophenyl phosphate will act as a substrate that will be catalyzed by the enzyme to liberate p-nitrophenol compound as illustrated in the scheme below.
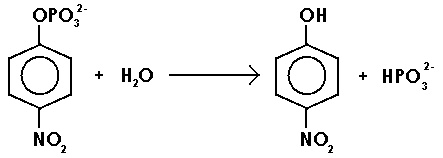
The product, a yellowish solution of p-nitrophenol, can be determined using a spectrometer at a wavelength of 405 nm. It is important to note that the concentration of this compound is proportional to the optical density of the solution (absorbance). As such, according to Michaelis, a plot of the rate of enzymatic reaction against the concentration of substrate assumes the trend 1 below:
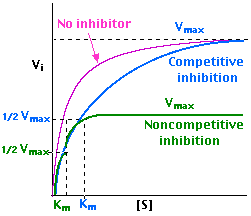
However, in presence of an inhibitor, the trend changes as is in 2 and 3 above for competitive and non-competitive inhibitors respectively. According to Lineweaver, the above trend can give a linear trend when the reciprocal of the variables are plotted as below:
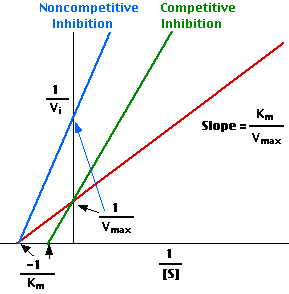
These variables are connected according to the equation below:
1/V1 = Km/Vmax (1/[S]) + 1/Vmax (Atkins & Paula 2006).
In this report, sodium molybdate will act as the enzyme inhibitor, and as such, we will determine both the mechaelis-menton constant (Km) and the the maximum velocity (Vmax).
Null Hypothesis
H0A: The rate of phosphatase reaction will be proportional to the p-nitrophenyl phosphate concentration initially before it reaches an optimal level as substrate concentration increases.
H0B: A competitive inhibitor will affect the Km by increasing it while a non-competitive inhibitor will affect the Vmax.
Alternative Hypothesis
H1A: the rate of phosphatase reaction will not obey Michaelis principle and hence will not assume his trend.
H1B: An inhibitor will have no effect on the enzyme.
Aims
The objective of this report was to verify the Michaelis-Menten principle and as such validate it using Lineweaver-Burke principle. This was done separately in absence and presence of an inhibitor.
Method
The following reagents were utilized in this experiment: 2 mM disodium p-nitrophenyl phosphate (substrate), enzyme extract, 1M NaOH, citrate buffer at a pH of 5 and 0.9mM of sodium molybdate- an inhibitor.
Before the commencement of the experiment, the enzyme phosphatase was obtained from the wheat germ and then diluted appropriately before it was utilized later in the experiment.
The experiment commenced when a 20 mL volume of a 0.3 mM reagent of disodium p-nitrophenyl was made from a 2 mM of the same. Different volumes of the substrate were added in 11 pairs of well labeled test tubes such that the first nine pairs held volumes of a 0.3 mM p-nitrophenyl phosphate while the last two pairs held a 2 mM of the same. The substrate volumes in the tubes followed the patterns shown in the tables below:
Table 1: without an inhibitor.
Table 2: in presence of an inhibitor.
To each tube, and with the exception of the first pair (1 and 12), a 1.2 mL volume of the enzyme was added one at a time after every minute from the first to the last tube. Another set of 22 tubes each containing 1mL of NaOH were lined up to stop the reaction after ten minutes of incubation when the enzyme had been added. This was done by siphoning a 2mL volume of enzyme containing solution into the NaOH containing tubes to make a 3 mL solution in a tube. With a spectrophotometer set at 405nm, the absorbance of this tube was measured and recorded for analysis.
Results
The below calculation will lead us to getting the concentration of the substrate [S].
We begin by calculating the moles (m) of the substrate present in a tube. For instance, taking tube 2:
m = Molarity*Volume of substrate = 0.3*0.12= 0.036 moles.
To get the concentration of the substrate = moles/ total volume.
But, the total volume = substrate volume + water volume + buffer volume + enzyme volume = 0.12+2.68+2+1.2= 6mL
Therefore, [S] = 0.036/6 =0.006 mMΞ0.006*1000 μM= 6μM.
On the other hand, in presence of an inhibitor, for instance, tube 18: m =0.3*1.32 =0.396 moles.
[S]=0.396/ (1.32+1.28+2+0.2+1.2) = 0.066 mM =66 μM.
To get [P] the formula below is applied:
v0 =dP/dt
Therefore, the moles of P = v0*t. But, v0 is the reaction rate or the absorbance and t is the incubation time (10min). For example, for tube 3: P=0.005*10=0.05mili moles.
Therefore; the concentration [P] = moles/volume. But, volume is constant Ξ 3mL
Hence, [P] =0.05/3 =0.017 mM.
In order to obtain the quantity of P which is equivalent to the number of moles in the solution we apply the formula below:
For example, for tube 3; m = Molarity*Volume = 0.017/1000*Volume.
But, volume =volume of the siphoned liquid + volume of NaOH = 2+1=3mL
Therefore; m=0.017/1000*3/1000= 0.15×10⁻⁶moles= 0.051μm
The rate of reaction in μmolmin-1 is given as below:
For example, for tube 3; v0= 0.051/10 moles/min = 0.0051μmoles per min.
The reciprocal of [S] is given as below:
For instance, tube 3; 1/[S] = 1/12 = 0.083 mM-1
The reciprocal for v0 is given as below:
For instance, tube 3; 1/v0=1/5 = 0.2min/μmol
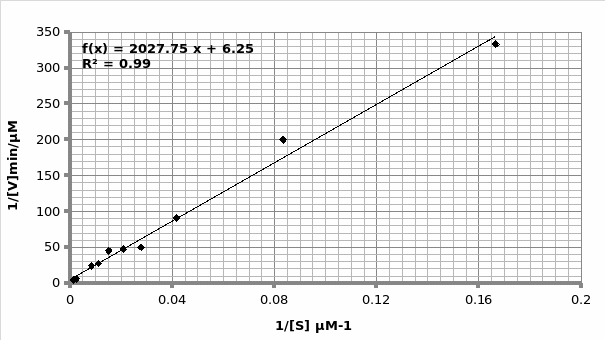
Graph 1 of Lineweaver-Burke reaction in absence of an inhibitor.
1/2Vmax
Vmax=0.33
Km=325
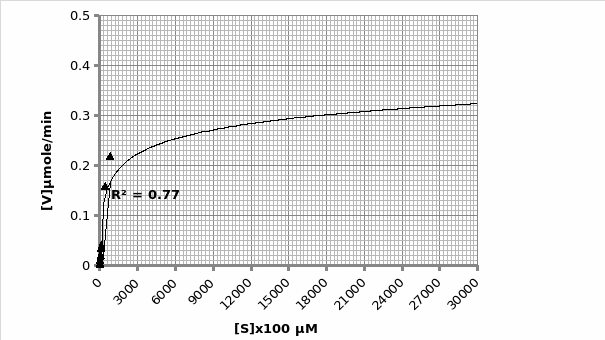
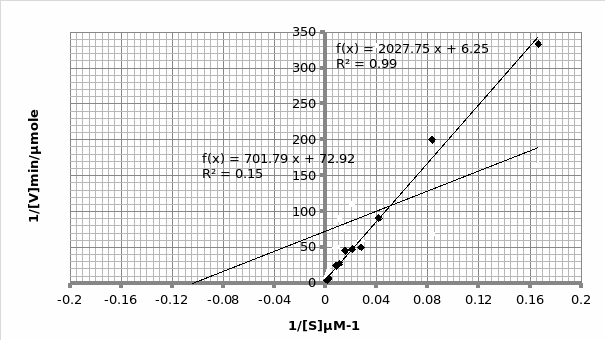
Example of calculation for obtaining Km and Vmax using Michaelis-Menten graph (graph 2):
The graph is in the form of y=mx+c. Therefore; 1/V1 = Km/Vmax (1/[S]) + 1/Vmax.
As such, gradient of the line 2027 = Km/Vmax. But, the y-intercept = 1/Vmax=6.252 min/μmol.
Therefore; Vmax=1/6.252 μmol/min = 0.16 μmole/min
Km=2020*0.16= 324.2 μM.
For Lineweaver-Burke, this is obtained directly from the graph.
Hence; For Lineweaver-Burke: Km =325 μM Vmax = 0.33 μmole/min
For Michaels-Menten: Km =324.2 μM Vmax = 0.16 μmole/min
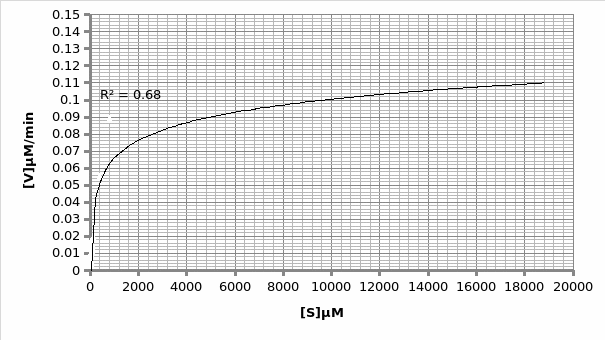
Km=600
Vmax=0.11μmole/min
1/2Vmax
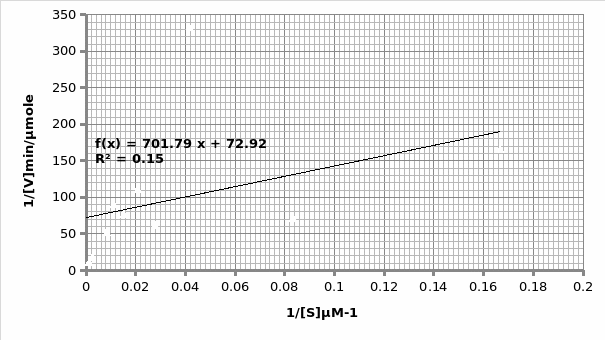
In presence of an inhibitor: For Lineweaver-Burke: Km =600 μM Vmax = 0.11 μmole/min
For Michaels-Menten: Km =9.62 μM Vmax = 0.014 μmole/min
When plotted on the same graph, the below trend is observed:
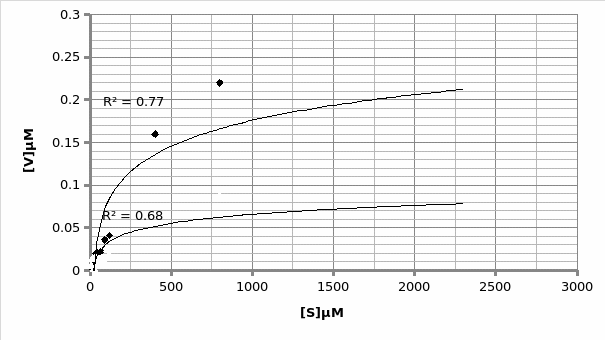
In presence of a competitor.
In absence of a competitor.
Discussion
The objective of this experiment was to verify the Michaelis-Menten principle and as such validate it using Lineweaver-Burke principle. This was done separately in absence and presence of an inhibitor. From the two experiments performed, the only experiment that displayed the expected trend was the one that was performed in the presence of an inhibitor (Graph 1 and 2). This can be attested by the R2 scores- 0.769 and 0.989 for Lineweaver and Michaelis respectively, which are almost equal to 1. As such, we will rely more on Michaelis results for comparison purposes with the actual. The opposite is true for the second experiment which was performed in the presence of an inhibitor; 0.683 and 0.148 for Lineweaver and Michaelis respectively (Graph 3 and 4 respectively). This shows that the second experiment was flawed. As such, the data collected had a lot of outliers that were responsible for the inaccurate trends. This could be attributed to the temperature fluctuations.
For the first experiment, the values for Km (325μM) were tallied using both trends. However, there was a difference in the Vmax (0.33 against 0.16 for Lineweaver and Michaelis respectively). The second experiment displayed varied values owing to experimental errors. When we compare the Km value (325μM) obtained in this experiment with the actual Km (1500μM) value for phosphatase, we can conclude that the enzyme is not at its optimum functioning. This was anticipated since phosphatase functions optimally in an alkaline environment of between 8-10 pH. Similarly, the Vmax (0.12μmol/min) is expected to be lower than the actual Vmax (20 μmol/min).
Conclusion
As explained above, this experiment was flawed, making it difficult to identify the type of competition present. However, assuming the outliers, the inhibitor exhibited a competitive inhibition (Graph 6).
References
Atkins, P & Paula, J 2006, Physical Chemistry for the Life Sciences, W. H. Freeman and Company, New York.
Chang, R 2005, Physical Chemistry for the Biosciences, Thomson Learning, South Melbourne.