Introduction
Conducting predictive analysis is an essential part of statistical research, yielding findings with broad practical implications for making informed, data-driven decisions. This paper investigates data from Khalifa Bin Salman Port in Bahrain, a major seaport that plays a key role in the country’s economy (Al-Bahrayn, 2021). For this port, data were collected on monthly container throughput over six years, the country’s GDP and GDP per capita, and imports and exports, including those realized through this seaport; all data were collected from 2017 to 2022.
In addition, to validate the analysis, actual data on the port’s container throughput for the first eight months of 2023 were collected. Predictive analysis of the collected data involved using various models and methodologies, with the ultimate goal of identifying the optimal model, thereby improving the overall quality of predictions and the model’s reliability. The paper is a detailed report that describes the modeling steps in sequence and offers an in-depth critique of the data.
Time Series Analysis
Container Throughput
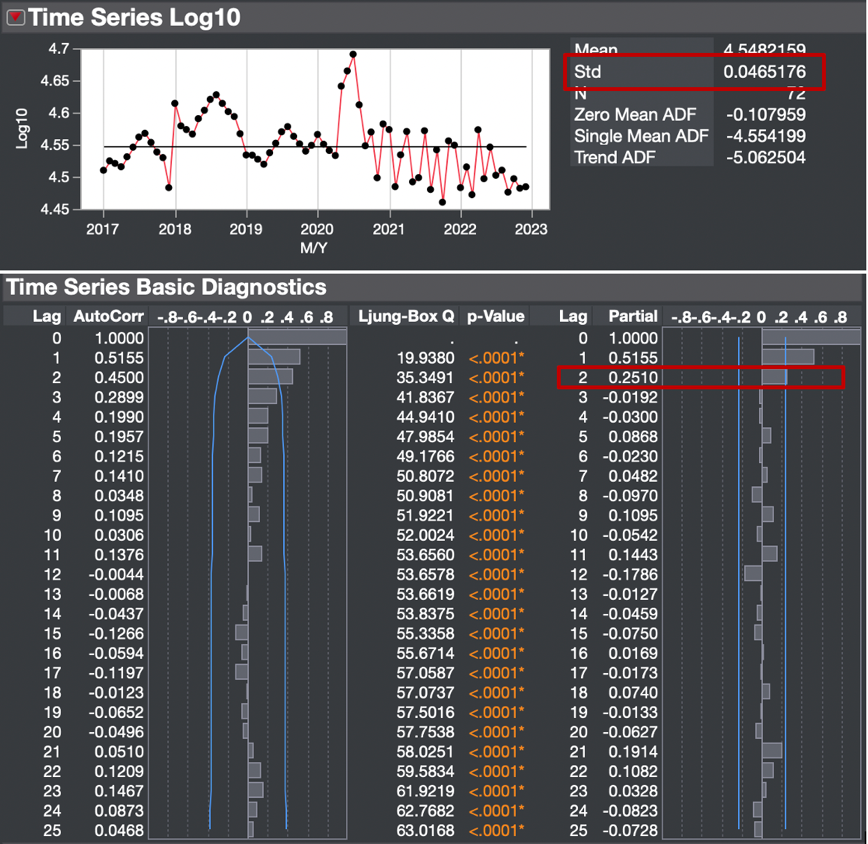
A time series was constructed for six years of container throughput data (N = 72) (see Figure 1). The first finding is that the time series is not cyclical, suggesting no apparent seasonality in port throughput and no heteroscedasticity. Since the series is not stationary, it is appropriate to apply an initial log transform to the data, which smooths trends, makes outliers less perceptible, and brings the distribution closer to normality (Huang et al., 2020).
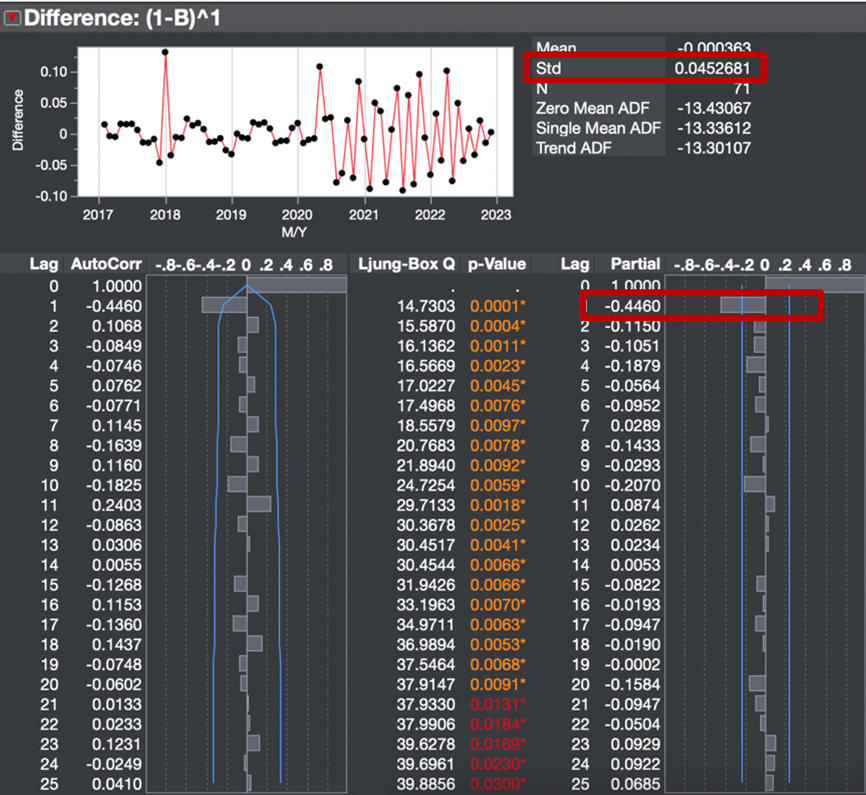
It can be seen that, starting in late 2020, port throughput showed an overall downward trend. As shown in the PACF plot in Figure 1, the second lag was significantly different from zero. Constructing a first-order non-seasonal differential reduced the time series’ variability. It was thus selected as a practically valuable strategy, unlike other modifications that increased this characteristic.
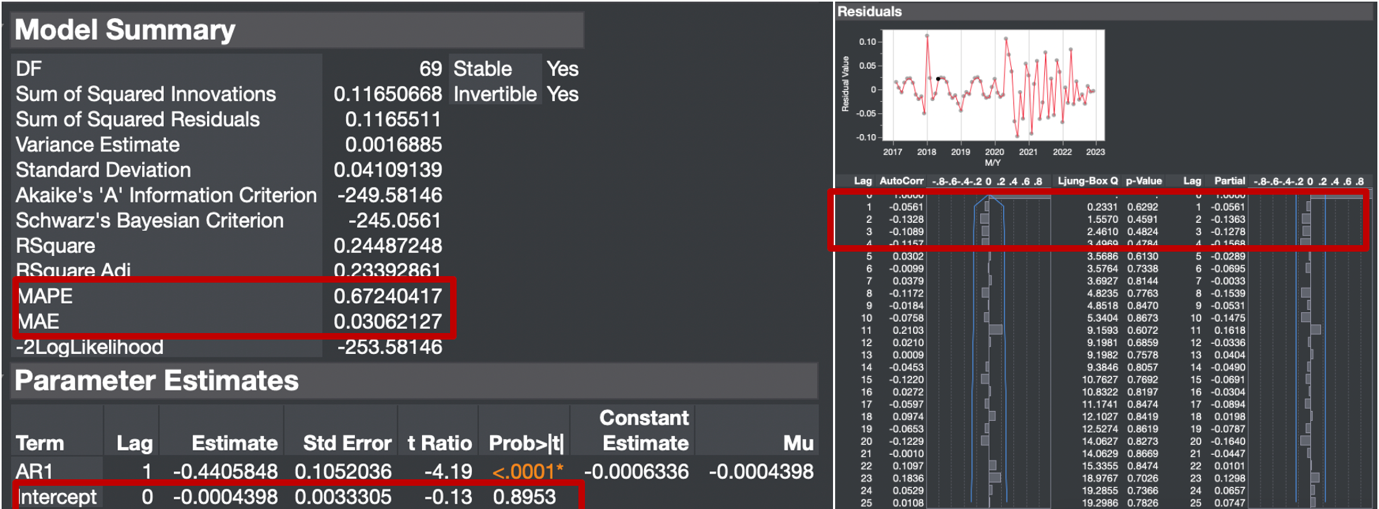
A non-seasonal ARIMA model was built from the results (seasonality was removed by first-order differentiation). Examining combinations of different settings (p, d, q) showed that ARIMA(1,1,0) was the best option based on the AIC comparison (see Appendix A) and the first-order differentiation analysis (Mohamed, 2020; Peng & Chu, 2009). Figure 3 shows that the developed ARIMA model achieved an MAPE of 0.67%, an MAE of 0.03, and a p-value of 0.90, accounting for up to 24.49% of the variance in the continuous variable. The results indicate generally good reliability of the constructed model, while it is essential to realize that the calculated intercept is statistically insignificant. One additional accuracy parameter of the constructed model is the decreasing significance of differences in lagged residuals from zero, as shown in the right panel of Figure 3.
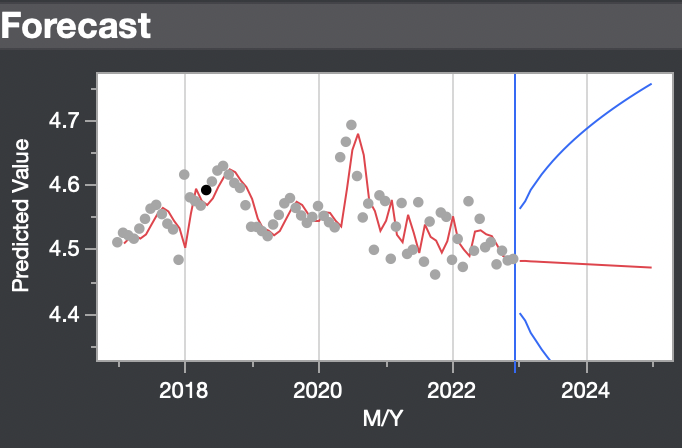
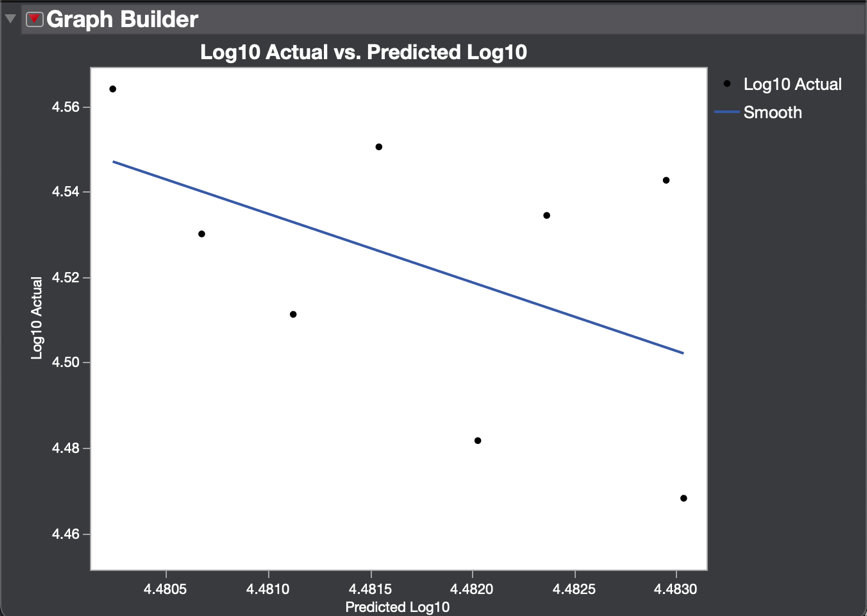
ARIMA(1,1,0) also outputs the predicted port throughput values for the next 25 months. As shown in Figure 4, the index is expected to decline further. Correlating the predictive values with the actual values for the eight months of observations (January through August 2023), as shown in Figure 5, demonstrates generally good predictive reliability, as the data exhibit a downward trend and are distributed around a diagonal line. Quantitatively, the reliability of the predicted values is assessed by the average prediction error of 1.00%, indicating a reasonably accurate prediction model.
Imports and Exports
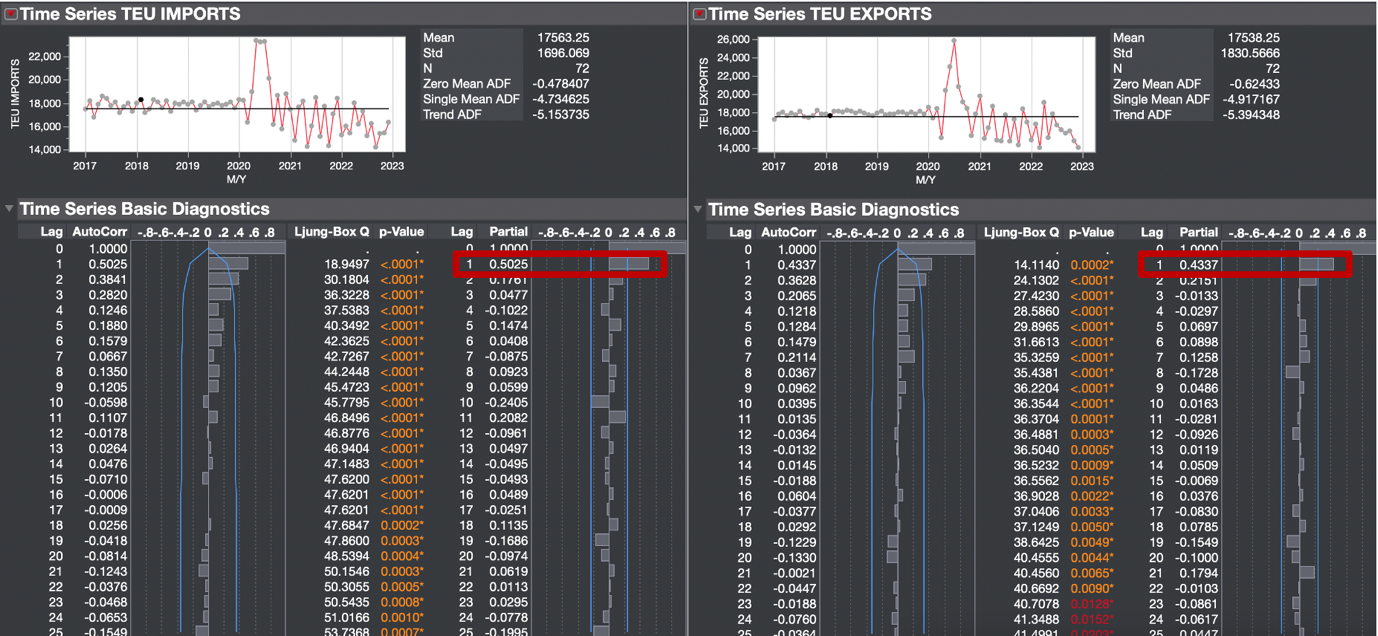
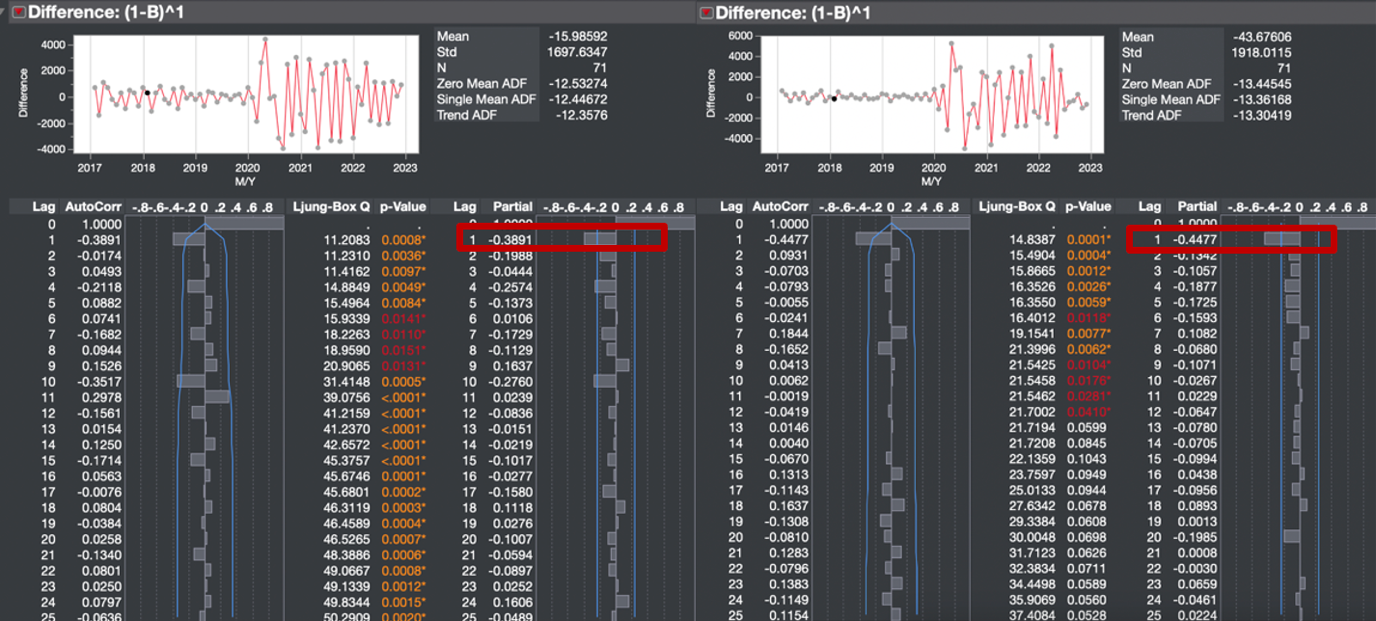
Time-series analyses of the import and export variables were also of interest in this paper. The original time series (without logarithmic transformation) is shown in Figure 6. Both series exhibit similar trends, and negative ADFs in both cases may indicate stationarity. The use of first-order differentials (as shown in Figure 7) indicates that the first lags in both cases are significantly different from zero. However, further comparison of the different forecasting models (as shown in Appendix B) shows that SARIMA(1,1,1,1),(1,1,1,1,12) is the best option for both variables, leading to a falling AIC and hence a more accurate model.
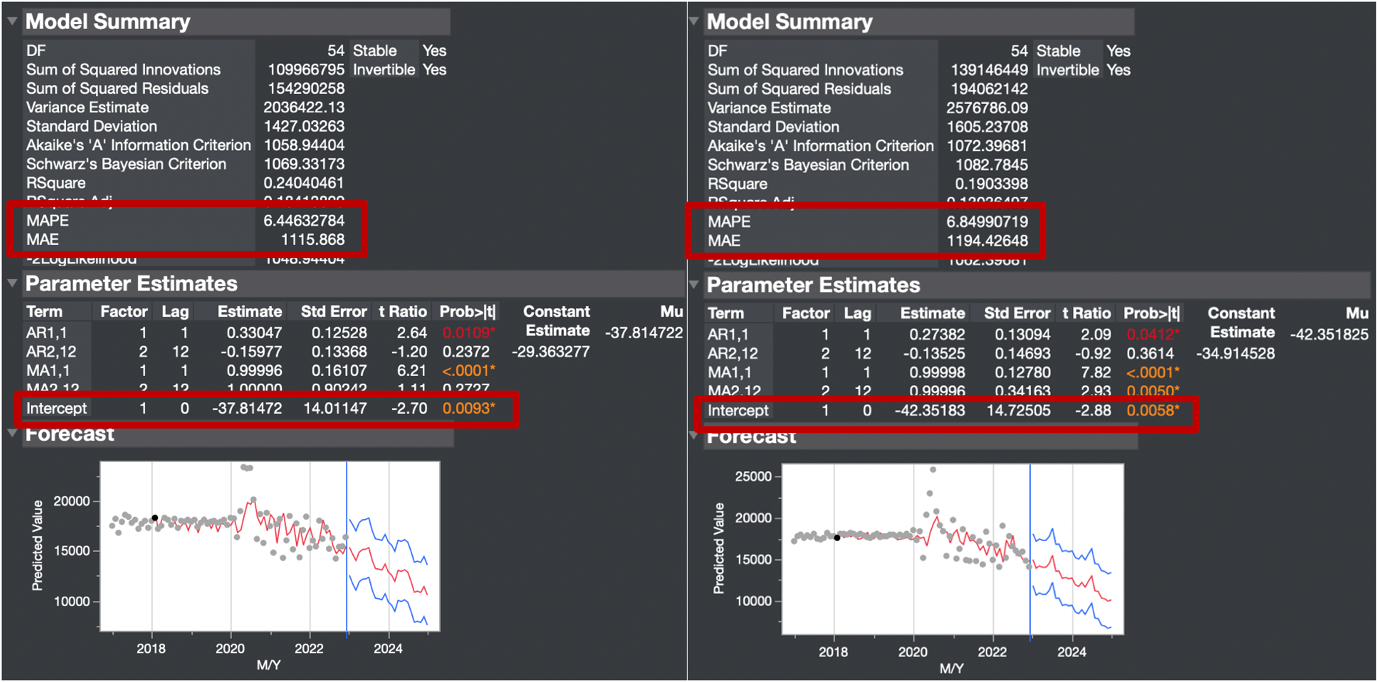
Thus, SARIMA(1,1,1,1) and (1,1,1,1,12) were applied to both time series; the simulation results are shown in Figure 8. Imports were characterized by the following model outputs: MAPE = 6.45, MAE = 1115.87, p =.0093; for exports, MAPE = 6.85, MAE = 1194.43, p =.0058. The models explained up to 24.04% of the variance in imports and 19.03% of the variance in exports. The predictive values for both variables showed a seasonal downward trend, indicating that imports and exports are expected to decline over the next two years, according to the model.
GDP
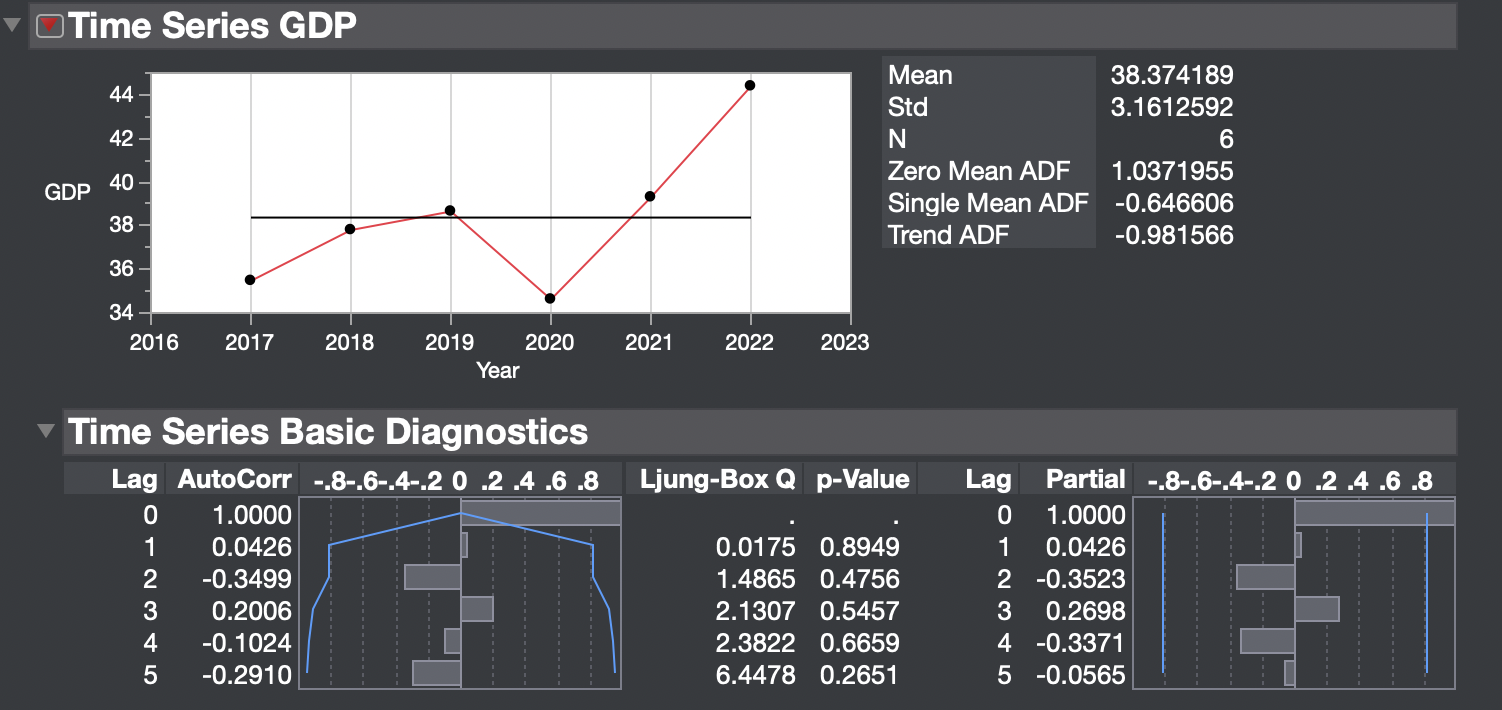
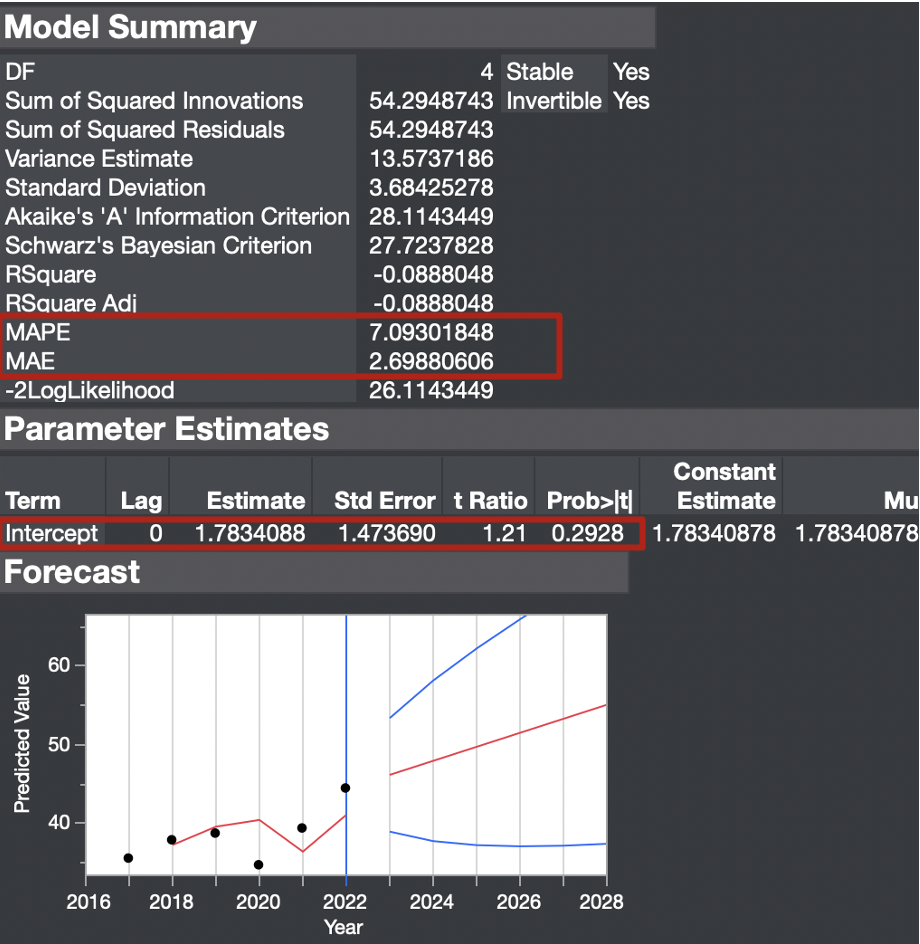
Finally, as part of the analysis, it was interesting to examine temporal patterns in Bahrain’s GDP over the past six years, from 2017 to 2022. As shown in Figure 9, the available data points are insufficient to identify significant patterns; however, all lags in the ACF and PACF were statistically significantly different from zero, providing a basis for selecting the ARIMA model. The lack of significant lags indicates that no differentiation was necessary, and the AIC results for the different ARIMA configurations (Appendix C) show that ARIMA(0,1,0) is the most appropriate. The model’s output parameters were as follows: MAPE = 7.09, MAE = 2.70, p =.29; however, the model had a negative coefficient of determination (Figure 10). The model’s predictive values indicate GDP growth for Bahrain over the next six years.
Reasoned Recommendations
The time-series analysis conducted reveals several significant findings with practical benefits for managers. First, it has been shown with a high degree of accuracy that the subsequent decline in container throughput at the port in Bahrain over the next 25 months is projected. Second, import and export parameters are expected to decline over the next two years. Third, based on the available data, GDP is expected to increase over the next six years. Thus, the following sound recommendations and strategies apply to the port managers:
- Continuously monitor data to track operations related to port activities closely.
- Make appropriate business decisions based on the projected downward trend.
- Optimize port infrastructure to accommodate declining demand.
- Reduce resources and costs to support port operations in light of declining demand.
- Given projected GDP growth, invest in port development, possibly with sustainable technologies.
- Given the projected downward trends, it is recommended at a broader level to rethink the country’s economic model, strengthening the role of exports.
- Consider launching related services to compensate for the projected capacity reduction.
References
Al-Bahrayn, A.M. (2021). Bahrain.
Huang, J., Chu, C. W., & Tsai, Y. C. (2020). Container throughput forecasting for international ports in Taiwan. Journal of Marine Science and Technology, 28(5), 1-16.
Mohamed, J. (2020). Time series modeling and forecasting of Somaliland consumer price index: A comparison of ARIMA and regression with ARIMA errors. American Journal of Theoretical and Applied Statistics, 9(4), 143-53.
Peng, W. Y., & Chu, C. W. (2009). A comparison of univariate methods for forecasting container throughput volumes. Mathematical and Computer Modelling, 50(7-8), 1045-1057.
Appendix A — AIC comparison for different ARIMA models for container throughput
Appendix B — AIC comparison for different (S)ARIMA models for imports and exports
Appendix C — AIC comparison for different ARIMA models for GDP.