Statistics are the base of any quantitative research (Wyse, 2011). They allow analyzing data gathered from numerous test samples and compiling it in a way for the researchers to see connections between them. These patterns simplify the analysis of the results of an experiment. The program Minitab is an automated tool that can be used for statistical research. It analyzes the results of the experiments in a fast and efficient manner. It has several useful features that can be used by the researchers, such as (“Analyzing data,” 2016):
- Regression
- ANOVA
- Quality tools
- Time series
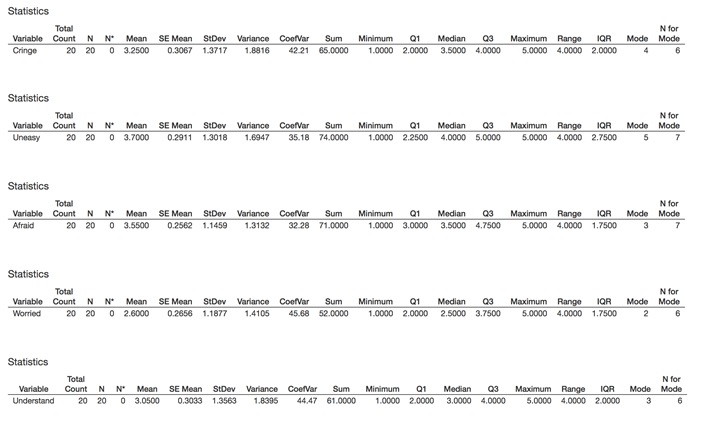
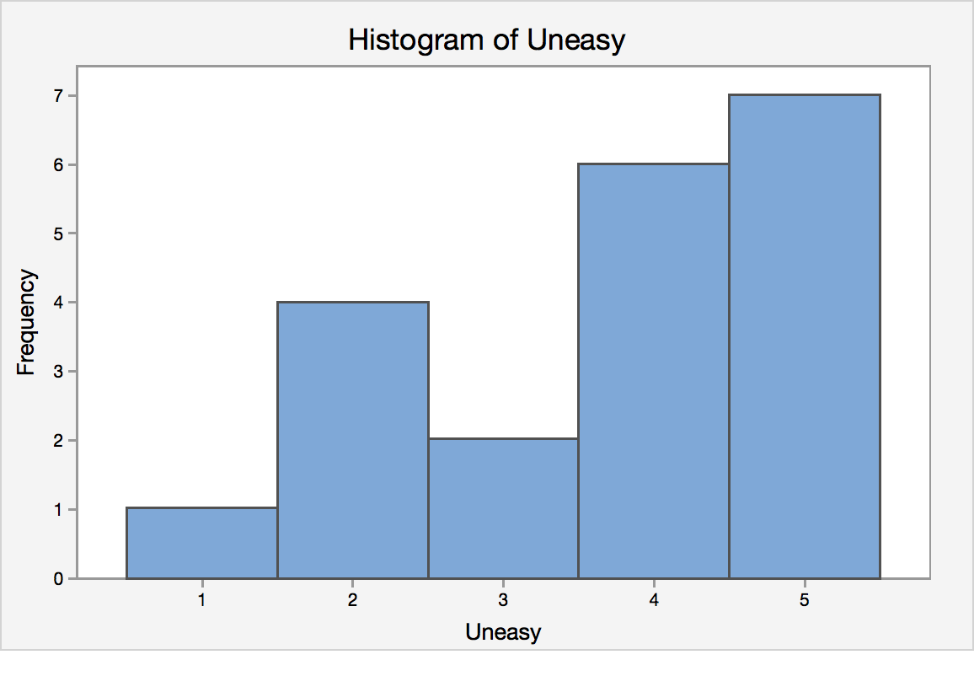
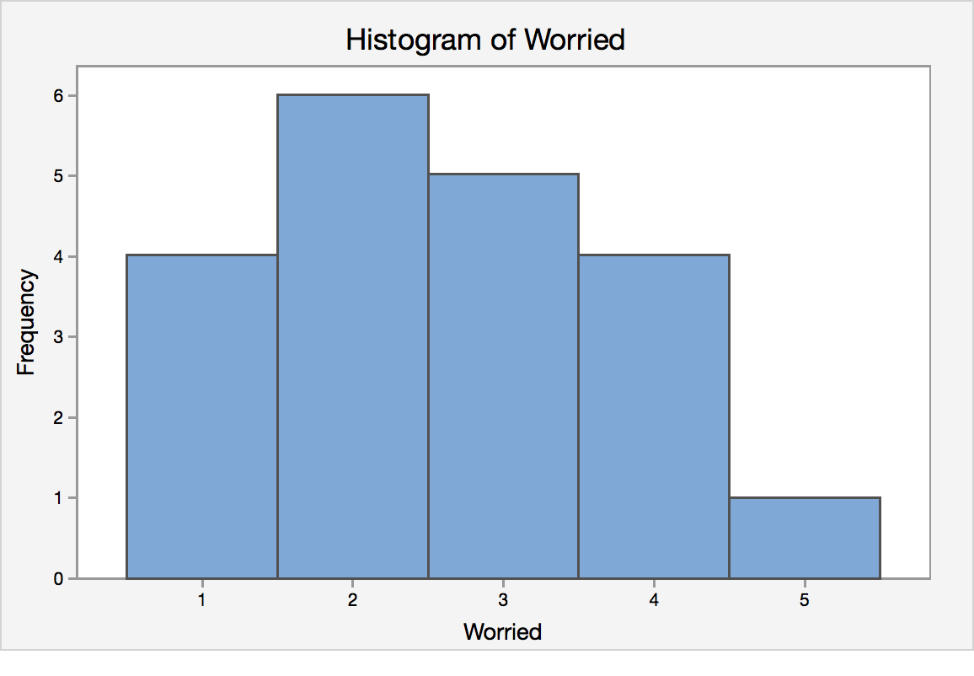
Other features of the program include a built-in graph generator and a storage space for accumulated data. Minitab is particularly useful when dealing with descriptive statistics. The program eliminates the factor of human error by automatically performing all the required calculations. For our calculations, it is possible to see that the lowest mean for Worries is at 2.600, while the highest mean for Uneasy is around 3.700. According to the data, every sample had a potential minimum of 1, and a maximum of 5.
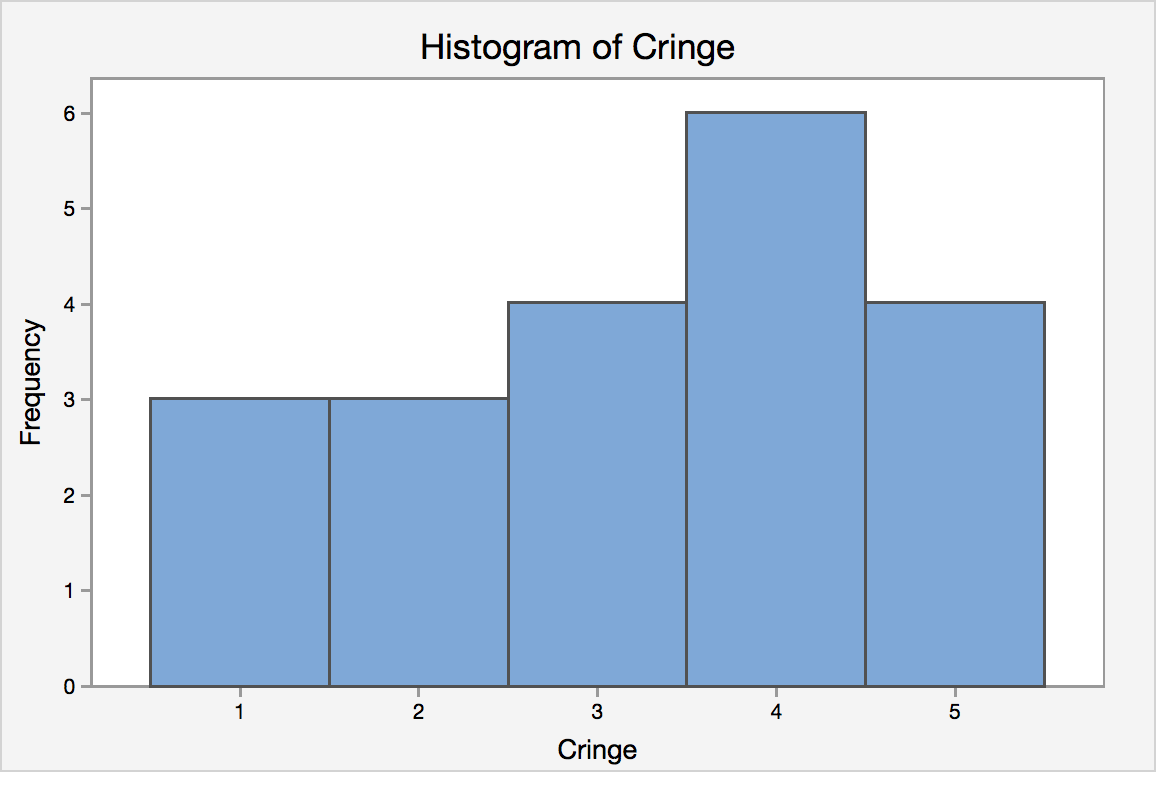
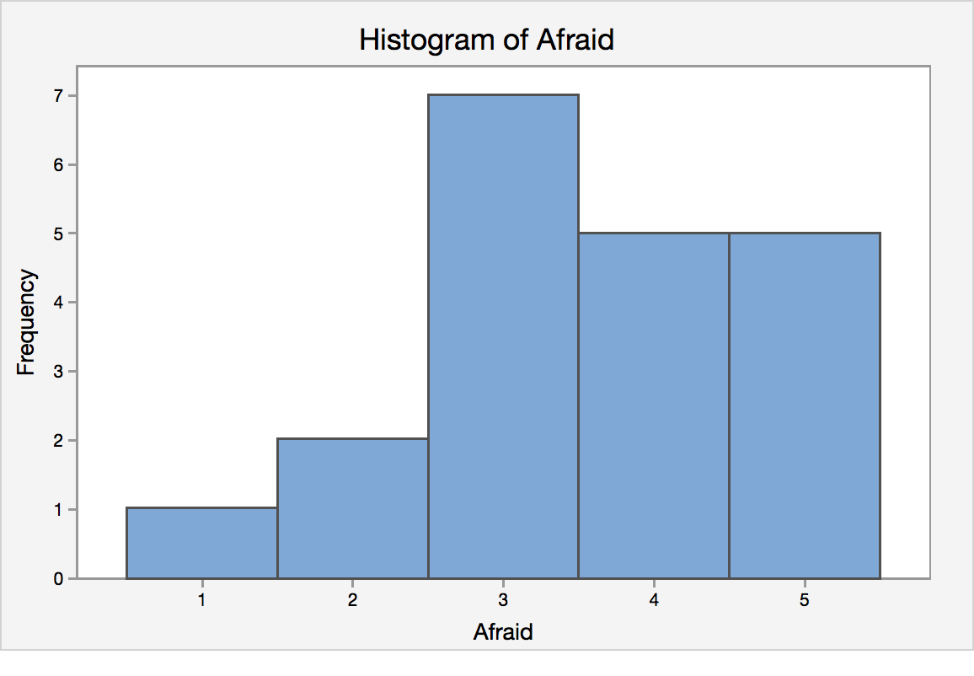
Thus, the program allows us to determine which variables hold the minimum and maximum math anxiety range. The graphs reflect on this and allow the researchers to visualize the results better. Aside from means and standard deviations, the descriptive statistics tab also allows us to calculate and display the median range, mode, interquartile range, sum, trimmed mean, and many other statistics that can prove invaluable in research. The program itself is intuitive and fairly easy to navigate. Following the instructions to get the required results were very easy. Here are the pictures of the results attached to this paper:
After using Minitab to perform this exercise, I discovered that it is indeed a very simple and useful program that has many positive features. It will be very useful for any statistical researches that I will perform in the future. It is also a great improvement over having to do all the calculations and graph-building by hand. However, I know that this program has many other useful features besides descriptive statistics. The program also features other useful tools, such as regression, ANOVA, time series, and quality tools. I am looking forward to learning to use these tools and utilize the program to its full potential. Another thing that I will need to learn is how to use the Minitab Project Manager to shift between different graphs and data sheets with ease.
My future projects will involve statistical analysis, and I will likely use Minitab to calculate the means, medians, ranges, and other statistics relevant to my research. The ANOVA, on the other hand, will be useful in comparing two or more means (“ANOVA (Analysis of variance),” 2016). This function is frequently used in statistical research. For my project that involves studying the effects of PEFM therapy to treat neuropathic pain, the program could be used to find means of how the patients would rate their pain, on a scale of 1 to 10. It can also be used to find the mean age of all participants involved in the experiment. At the end of this reply, I attach pictures of graphs generated in Minitab.
References
Analyzing data. (2016). Web.
ANOVA (Analysis of variance). (2016). Web.
Wyse, S.E. (2011). What is the difference between qualitative research and quantitative research?