Introduction
The R programming language is beneficial for researchers and professionals in multiple domains. Within the vast domain of programming, it is essential to understand the strengths and utilities of a particular language, especially in sectors like healthcare, where data plays a critical role. The same consideration applies when choosing tools for application development and understanding how they integrate with popular programming languages, such as R. The unique attributes of R include its powerful visualization capabilities and its seamless interface with platforms like Microsoft Visual Studio.
Advantages and Disadvantages
A significant advantage of the R programming language is that it is open-source, which makes it accessible and cost-effective for healthcare researchers. The healthcare industry benefits from R’s extensive package ecosystem because it is easy to use and has a powerful visualization toolbox (Haymond & Master, 2020). Additionally, R is well-suited for well-defined problems, which are common in healthcare. However, R can exhibit lower flexibility, and it is most useful for the statistical community, whereas Python has a better general purpose (General Assembly, 2015). It is also worth noting that security concerns can arise when using R in healthcare since it may not always adhere to strict health data protocols.
Applications in Research
Researchers utilize R for statistical analysis, aiding in clinical trial evaluations and outcome assessments. R excels in creating high-quality visualizations, which assist in the interpretation of complex health data; hence, interpreting and assessing statistical results can be done effectively through the use of R (Data Flair, n.d.). Population statistics, quality control compliance, and turnaround times are metrics that are best calculated and measured using the R programming language.
Decision-Making Statements
The decision-making statement in R programming includes ‘If Statement,’ ‘Else Statement,’ and ‘Else If Statement’ (Naveen, 2023). In R, the if statement evaluates a condition and executes the subsequent code block when that condition is true. The else statement in R specifies a block of code to be executed if the associated if condition is false. The else if statement in R allows for the evaluation of additional conditions if the previous if (or else if) conditions are not met. The three corresponding examples are shown in Table 1 below.
Table 1 – Examples of Statements (Source: Naveen, 2023)
Visualization
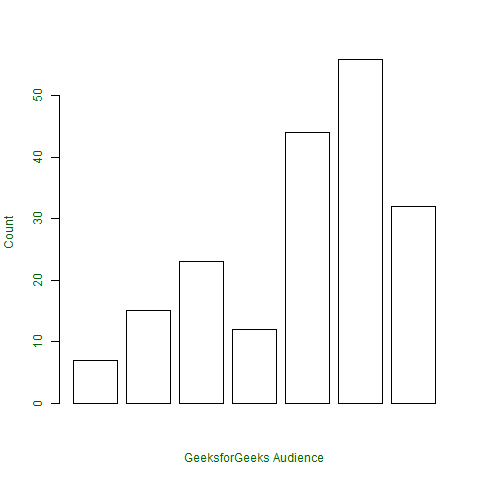
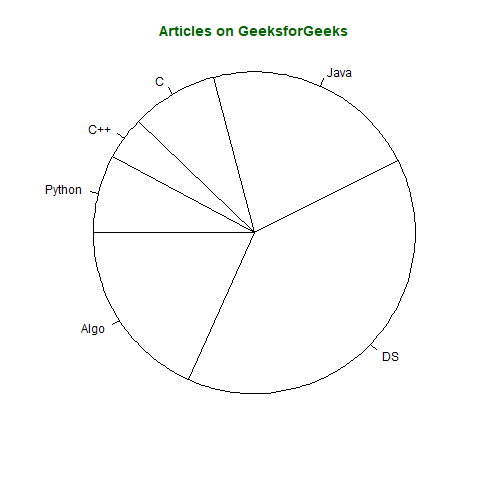
The R programming language offers numerous visualization options, including bar charts and pie charts. For example, a bar chart can depict the frequency of different disease diagnoses by illustrating the prevalence of each ailment in a healthcare dataset; however, a pie chart in R might display the proportion of hospital admissions by department, offering a clear visual representation of resource allocation within a medical facility (Kumar, 2021). The examples for the two described visualization options are shown below.
Bar
# defining vector
x <- c(7, 15, 23, 12, 44, 56, 32)
# output to be present as PNG file
png(file = “barplot.png”)
# plotting vector
barplot(x, xlab = “GeeksforGeeks Audience”,
ylab = “Count”, col = “white”,
col.axis = “darkgreen”,
col.lab = “darkgreen”)
# saving the file
dev.off()
Pie
# defining vector x with number of articles
x <- c(210, 450, 250, 100, 50, 90)
# defining labels for each value in x
names(x) <- c(“Algo”, “DS”, “Java”, “C”, “C++”, “Python”)
# output to be present as PNG file
png(file = “piechart.png”)
# creating pie chart
pie(x, labels = names(x), col = “white”,
main = “Articles on GeeksforGeeks”, radius = -1,
col.main = “darkgreen”)
# saving the file
dev.off()
R Project Development in Microsoft Visual Studio
The purpose of Microsoft Visual Studio is to provide a comprehensive development environment for software solutions, web services, and application development. It supports multiple programming languages, and developers rely on its advanced debugging tools, which facilitate the identification and resolution of code errors (Microsoft, 2023). Its integration capabilities with other Microsoft products improve the software development process. The commands used to create a new R project in Visual Studio are as follows:
- Open Visual Studio
- Select File > New > Project (Ctrl + Shift + N)
- Choose ‘R Project’ from under Templates > R
- Enter the project location and name
- Select OK (Microsoft, 2017).
Conclusion
In conclusion, R’s strengths and challenges highlight its high applicability in healthcare, particularly in terms of visualization and ease of use. Furthermore, integrating tools such as Visual Studio with R makes it even more suitable for healthcare professionals. It can be utilized in laboratories, population health analyses, and even quality control. As the healthcare field expands, the synergy between programming, data analytics, and software development tools will only grow in importance.
References
Data Flair. (n.d.). Pros and cons of R programming language – Unveil the essential aspects!
General Assembly. (2015). Introduction to R programming with DataCamp [Video]. YouTube.
Haymond, S., & Master, S. (2020). Why clinical laboratorians should embrace the R programming language. Association for Diagnostic and Laboratory Medicine.
Kumar, U. (2021). R – Charts and graphs. Geeks for Geeks.
Microsoft. (2017). Get started with R Tools for Visual Studio.
Microsoft. (2023). What is Visual Studio?
Naveen. (2023). Control flow statements in R – Decision making and loops. IntelliPaat.