Introduction
Hurricanes, tsunamis, earthquakes, and wars are emergencies that are beyond people’s control. However, they significantly affect all spheres of human life, causing damage and other negative consequences. The 2011 earthquake and tsunami in Japan was a prominent disaster that shocked the entire world. In particular, the automobile industry experienced essential impacts because many manufacturers were located in Japan. The crisis taught that the industry’s supply chain is subject to multiple risks, and it is reasonable to assess them properly to prepare for the potential negative scenario.
Summarizing the Risks
Since the 2011 disaster fundamentally affected the automobile industry, the available literature can demonstrate what risks can arise if a similar emergency occurs in the future. To find potential risks, I engaged in a brainstorming process and relied on the existing evidence to enrich my subjective opinions with facts.
First, natural phenomena imply enormous and uncontrolled force that is dangerous to the environment. That is why such disasters can frequently cause physical damage to manufacturing facilities (Kaviani et al., 2020). Second, even though an earthquake is a short-term phenomenon, it produces long-lasting consequences and takes much time to recover. Thus, a potential risk refers to decreased production volumes with all the associated financial consequences (Canis, 2011). Third, inventory shortage is another threat because leading manufacturers typically rely on global supply chains (Freund et al., 2022). Thus, even if a disaster affects a single country, the global industry can suffer from this issue.
Fourth, any crisis results in the fact that it becomes more difficult to do business. This issue, among others, manifests itself in higher costs, which makes the entire supply chain more expensive for organizations (Wheatley & Ramsay, 2011). Fifth, various manufacturers can witness different impacts from an emergency. Thus, a company can be subject to reputation damage if it suffers from a decrease in production or inventory shortages, while its main competitors are less affected. Table 1 below summarizes all the identified risks to automobile manufacturers.
Table 1 – Risks Summary.
Risk Assessment
A qualitative approach is used to assess the probability of each risk occurring. No threat witnesses a low probability because natural disasters are frequent. In the USA alone, 18 emergencies occurred in 2022, resulting in $175.2 billion in damage (Gusner & Masterson, 2023). This number might be significantly higher for the entire world, which is why most risks are expected to have high probabilities. This assessment refers to the following threats: physical damage, decreased production volumes, and higher costs. The other risks, inventory shortage, and reputation damage are said to have medium probability levels. Gut feelings and the available literature were used as a rationale to arrive at these conclusions.
The next step is to analyze the impact of the identified threats. The high, medium, and low labels are assigned based on how strongly a risk can affect the organization’s manufacturing ability. This strategy seems appropriate because it is challenging to quantify the threats in terms of dollars without having specific financial information for a company. Whereas the information about the cost of manufacturing facilities or the cost of delays is not available, the qualitative approach is used. Since the physical damage to the facility results in a complete manufacturing shutdown, the impact of this risk is high. Decreased production volumes, inventory shortage, and higher costs are of medium impact since their influence on the manufacturing ability is milder. Finally, reputation damage has a low impact because it does not affect production at all. The information above has presented a systematized assessment of the five identified issues.
Visualizing the Risks
Now, it is reasonable to visualize the threats to make it easier to perceive them and analyze their importance for the organization. A suitable way to cope with this task is to use a probability/impact table. This visual chart presents all the risks and uses colors (green, yellow, and red) to show the importance of the issues. Thus, the red color presents the most pressing risks, while green cells offer the least influential ones. Table 2 below is designed to analyze the scenario under consideration.
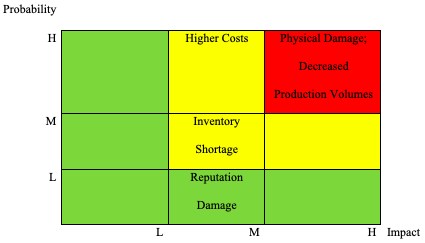
Table 2 demonstrates that physical damage to manufacturing facilities and decreased production volumes are the most pressing risks. Inventory shortage and higher costs are less topic threats because they are in yellow cells. Finally, reputation damage comes from the green area, which denotes that this issue should receive the lowest level of attention from management. This visual is convenient and effective because risk managers can easily determine the ranking of the identified threats. The ideal scenario is to manage the risks from the red cell and make them move to the yellow area to minimize the possible negative impact on business.
Risk Register
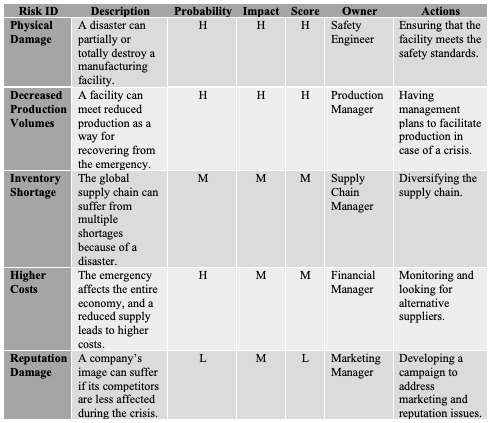
In addition to that, a risk register is an effective tool that helps record and monitor the assessed risks. Table 3 below represents this instrument for the selected scenario. It summarizes the information above and enriches it with a few details. First, Table 3 specifies risk owners, who are professionals responsible for risks and their management. Second, the Actions column explains how the assigned owners should deal with the risks. In particular, the column mentions what preventive actions the professionals should take to prepare for the potential emergency.
Conclusion
The given report presents a comprehensive approach to risk assessment. The first step was to determine and summarize the threats that could affect an automobile manufacturer as a result of a natural disaster. Risk assessment was the second stage, and it commented on the probability and impact of the issues. This information was further summarized and visualized in a probability/impact table. Finally, a risk register was created to specify risk owners and expected actions. All these processes have demonstrated that physical damage to a facility and decreased production volumes are the most significant risks that should receive the most attention.
References
Canis, B. (2011). The motor vehicle supply chain: Effects of the Japanese earthquake and tsunami [PDF document]. Web.
Freund, C., Mattoo, A., Mulabdic, A., & Ruta, M. (2022). Natural disasters and the reshaping of global value chains. IMF Economic Review, 70(3), 590-623. Web.
Gusner, P., & Masterson, L. (2023). Natural disaster facts and statistics 2023. Forbes Advisor. Web.
Kaviani, M. A., Tavana, M., Kowsari, F., & Rezapour, R. (2020). Supply chain resilience: A benchmarking model for vulnerability and capability assessment in the automotive industry. Benchmarking: An International Journal, 27(6), 1929-1949. Web.
Wheatley, M., & Ramsay, M. (2011). After the disaster in Japan. Automotive Logistics. Web.