Making Observations and Asking Questions
I visited WildCam Lab’s Data page, and the color-coding of the map according to plant type and natural features is described in a legend in the lower left corner of the screen. The orange dots show the locations of the cameras on the map. Any orange dots will activate a pop-up window when you click on it. I clicked on an orange dot, and six images were shown. The top of the pop-up window showed the camera position and plant type information. I chose another orange dot, and the observations are in the table below:
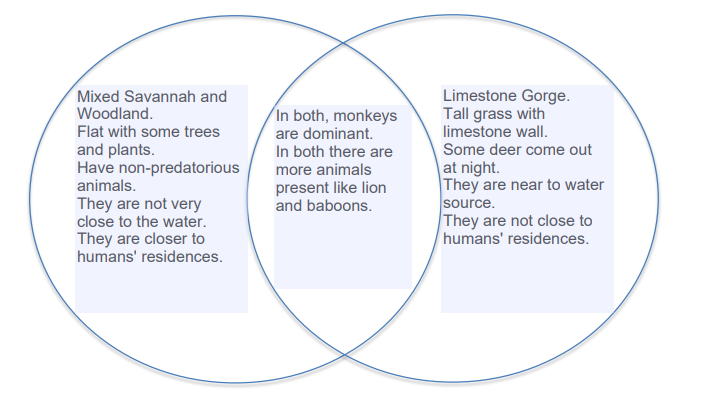
A mixed savannah woodland-grassland environment is characterized by sufficiently spread apart trees to prevent the canopy from closing. The open canopy enables enough light to penetrate the soil to maintain an uninterrupted covering of grasses-dominated herbaceous plants. On the other hand, the limestone gorge is a gap between limestone tiers where water cascades down to a river bed. The Venn diagram below shows the comparison between the vegetation types.
After choosing two filters and two new camera locations on the map, I observed the following.
The three possible research investigations could be made with the help of the information that trail cameras can provide. The first investigation is that besides floodplain grassland, which has fewer monkeys, there are more baboons in most places, such as limestone gorges. The second is to investigate the prevalence of deer during the night. It will give an insight into why more deer are not there during daytime in most places. The last research investigation is the kind of vegetation with more animals.
Animals begin to congregate around water sources in the summer when there is water scarcity, so there is more competition for water during this season. This is because animals need proper water for their body to function properly. After modifying the ideas of answerable questions with trail camera data, I realized that the number of animals near water bodies during summer differs from the number during winter. The research questions that are formulated focused on the population of animals, and they are as follows:
- How many animals are near water sources in the summer compared to the winter?
- Compared to mixed savannah, how many animals are present in limestone gorge during the summer?
Hypothesis and Prediction
The hypothesis that could explain the connections between the variables I am going to investigate with my research question is that because they prefer the water, there are many animals around plants and water. Water is needed, so there will be more animals competing for it. Animals need to consume as much water as possible because water decreases and evaporates during the summer season. Therefore, vegetation closer to water will have more animals. The independent variables in my testable entail vegetation and the distance to the nearest water source, while the dependent variable is the Animal abundance.
Actual Results and Interpreting Data
A Graph of Animal Population Against Different Seasons
The figure above shows a graph of the population of animals seen in the different seasons across the woodland plains and the mixed savannah woodlands in the Gorongosa National Park in Mozambique (Zooniverse classrooms).
Analysis and Feedback
The above graph is the population of animals seen in the different seasons across the woodland plains and the mixed savannah woodlands in the Gorongosa National Park in Mozambique. It shows that animal populations are higher during the Dry Jul- Sep and Dry Wet Oct-Dec seasons than in the Wet Jan-Mar and Wet Dry Apr-Jun seasons. The data findings supported my hypothesis because, according to the graph, the total population of mixed savannah and woodland and floodplain grassland is higher during the dry season than during the wet seasons. Therefore, my predictions are accurate since the Mixed Savannah and Woodlands are less dense, with fewer thickets and scattered trees (Herrero et al., 2020). In this widely spaced area, where there are a lot of monkeys, the grass could benefit from more light. The Floodplain Grassland has grassland areas thick with grass and dense thickets (Herrero et al., 2020). The two regions were highly populated with monkeys and gazelles.
This is how I would revise a new hypothesis based on my data analysis. I would first activate two filters and two camera locations and find interesting information. I would choose the Limestone Gorge habitat in one of the camera locations. The new hypothesis would occur during the dry seasons and using trail cameras. I expect to find more animal populations in the Mixed Savannah and Woodland vegetation compared to the Floodplain Grasslands. The independent variable would be the season and habitat type, whereas the dependent variable would be the number of Animals. Analyzing the data that was taken from the cameras found that there were more animals in the Mixed Savannah and Woodlands than in the Floodplain Grasslands in all seasons. The number of animals in each of the two areas increased in the dry season, whereas the numbers decreased in the wet season.
Trail cameras can provide research data that is testable and allow researchers to answer questions with information that can be validated. The number of animals can vary in the Mixed Savannah and Woodlands and the Floodplain Grasslands as the seasons change and the vegetation changes. Trail camera data have various limitations when used to answer research questions. According to Kolláth & Dömény (2017), trail cameras cannot accurately count the number of animals in a given area because some animals may hide, not be visible to the camera, or only emerge at night. During the night, it is not easy to distinguish some animals. Therefore, it cannot be easy to find precise data due to many variables.
If I were to approach the study of this subject differently, I would consider the kinds of species found in each habitat and season. Rather than relying solely on the total vegetation population, it would be more precise to include the various species discovered. Utilizing the sorts of species, seasons, and living space would permit me to separate the species involving a habitat since the camera photos can distinguish the creature’s species. The data inspire revised assumptions about Gorongosa, so the behavior of each species and animal can then be studied to determine the season of their habitat. These variables would reveal ways to safeguard the animals and the land.
References
Herrero, H., Waylen, P., Southworth, J., Khatami, R., Yang, D., & Child, B. (2020). A healthy park needs healthy vegetation: The story of Gorongosa National Park in the 21st Century. Remote Sensing, 12(3), 476.
Kolláth, Z., & Dömény, A. (2017). Night Sky Quality Monitoring in existing and planned Dark Sky Parks by digital cameras. International Journal of Sustainable Lighting, 19(1), 61–68.