Introduction
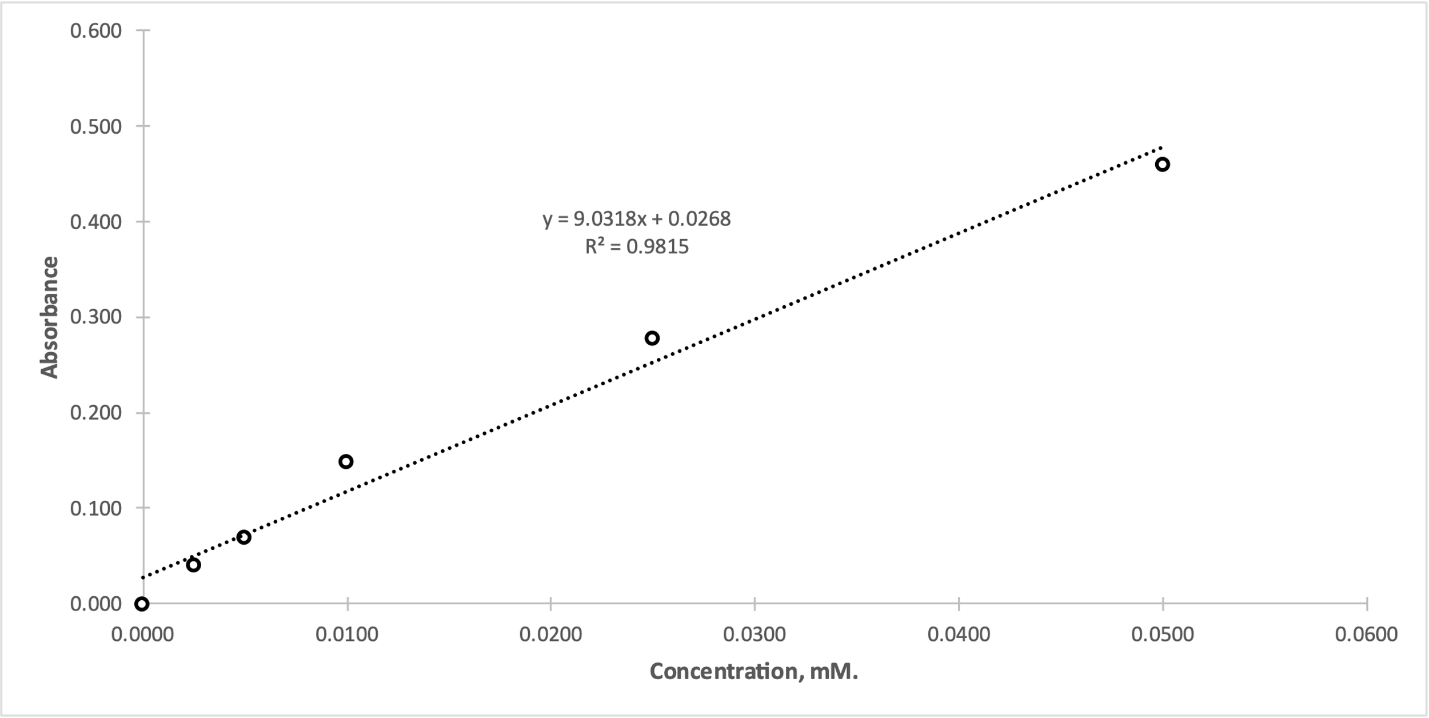
This entire laboratory project consisted of four parts, in each of which the enzymatic activity of Alkaline Phosphatase was sequentially prepared or studied. Table 1 shows the absorbance data for each of the six test tubes: as can be seen, the difference between them was the concentration of the enzymatic reaction product, p-nitrophenol, with the zero test tube being the negative control. In addition, Table 1 also contains data on the absorbance measured on the spectrophotometer. This information makes it possible to construct a standard curve showing the absorbance dependence on concentration.
Table 1. Reaction components and absorbance values for standard curve
One of the main conclusions that can be drawn from Fig. 1 is the correspondence to the expected upward trend, that is, with the increase of the product concentration in the mixture, there was an increase in absorption. The linear regression trend, also shown in this graph, shows that for every one micromole increase in the concentration of p-nitrophenol, there was an increase in the absorbance by 9.0318 L mol-1 cm-1.
Absorption as a Function of Enzyme Presence
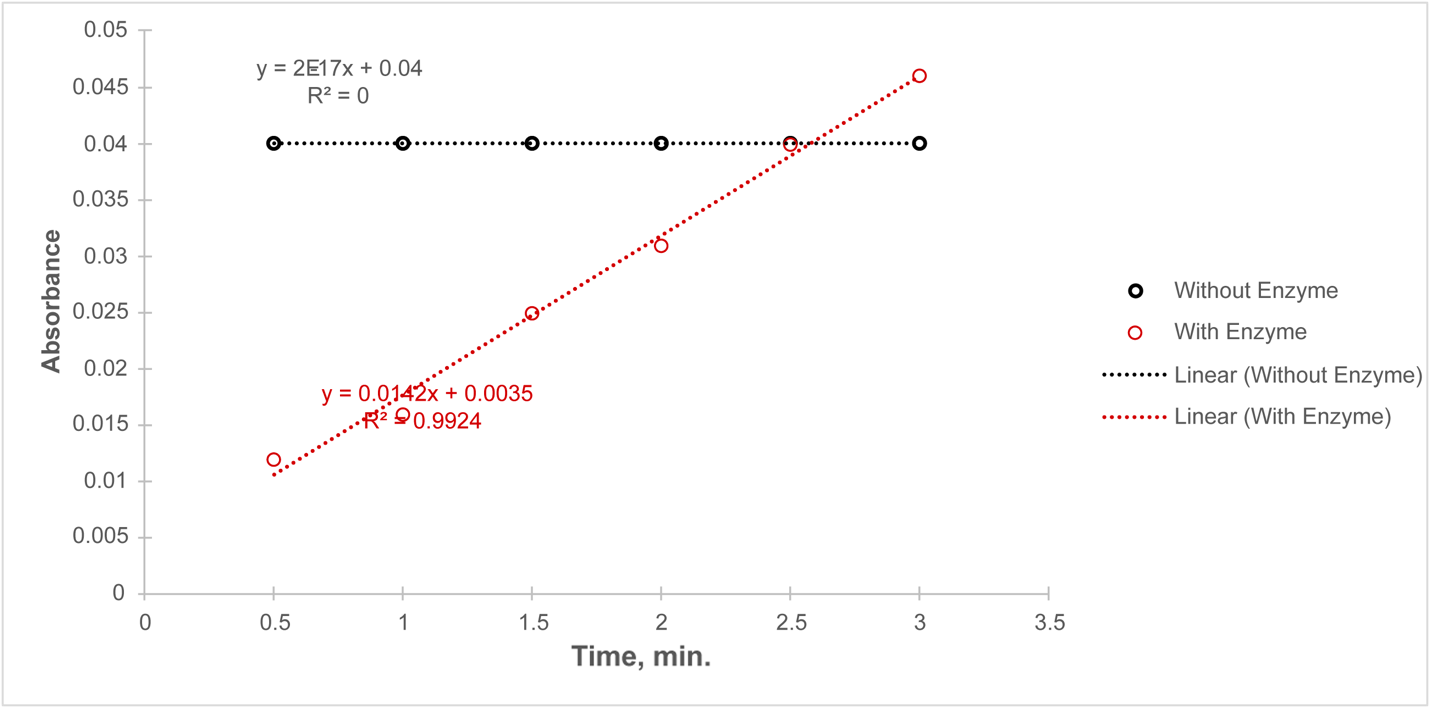
As part of the laboratory work, it was interesting to study the differences in absorbance for mixtures containing the enzyme and those without. Table 2 provides information on the dynamics of the absorbance ratio for the two tubes (1a and 2a) prepared during the second part of the experiment. The difference between the tubes was whether serum was added (2a) or not (1a).
Table 2. Reaction components and absorbance values at timed intervals for experiment 2
The absorption dependence with time shown in Figure 2 reports that in the absence of serum (black trend), there is no change in the absorption coefficient; that is, no reaction occurs. On the contrary, for tube 2a, in which the enzyme was added, the absorbance increased over time.
Absorption as a Function of Enzyme Concentration
Now that it was clear that the presence of the enzyme contributed to the increase in absorbance over time, it was interesting to investigate the dependence of the optical coefficient on the concentration of this enzyme. Table 3 contains data from the third experiment, for which the amount of enzyme was varied. Absorbances were also measured every thirty seconds for three minutes, yielding the dynamics for each of the six tubes.
Table 3. Reaction components and absorbance values at timed intervals (time in minutes) for experiment 3
The absorbance values obtained in this case for each product can be translated into concentrations using the regression equation for the standard curve. Table 4 shows the concentration values obtained by substituting absorbance into this equation, and the values of the last absorbance measurement were used, that is, after 3 minutes. The values obtained were visualized (Figure 4), and it is shown that for all six test tubes, the concentration of p-nitrophenol increased over time. The rate of this increase, however, did not differ significantly for each of the tests.
Table 4: Transition of absorbance to concentration for test tubes
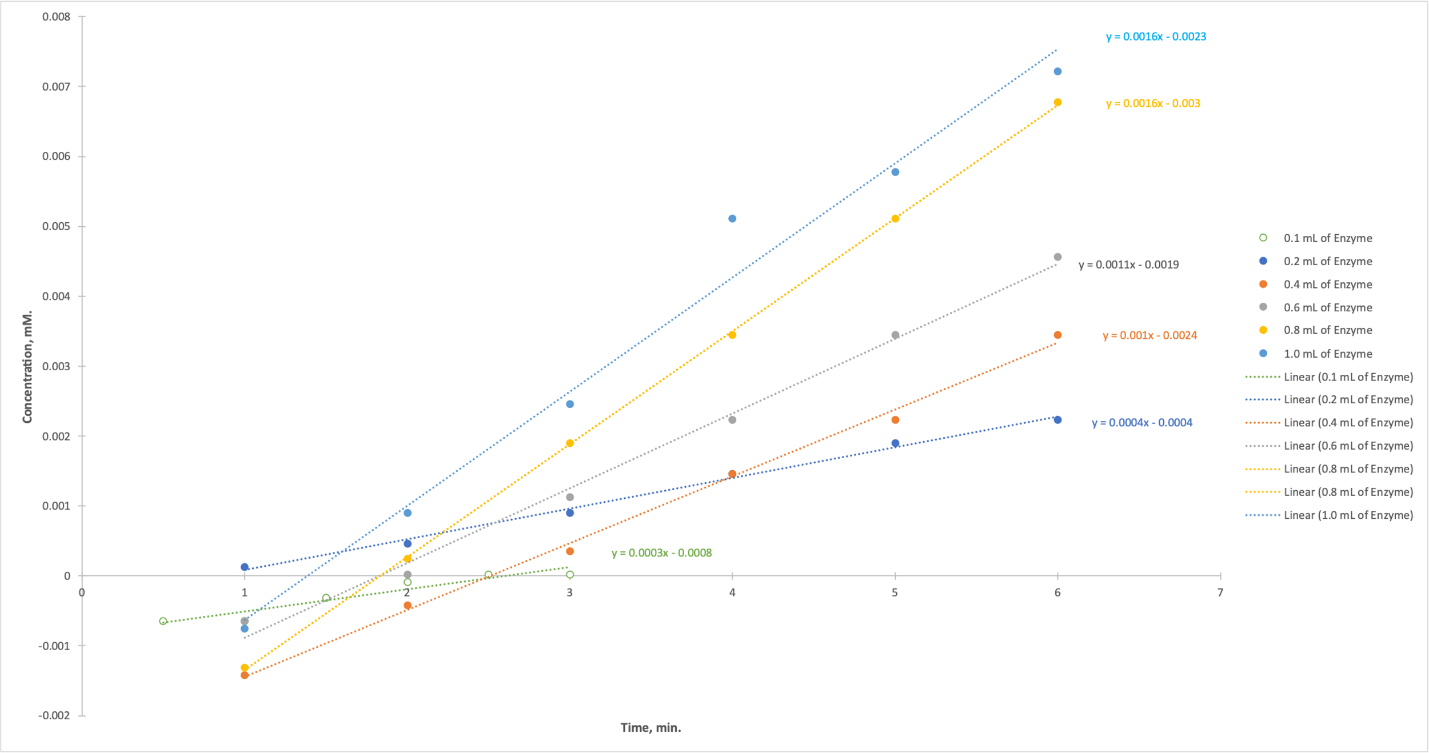
Figure 4 shows the dependence of enzyme activity (slopes in Figure 3) on serum volume. It can be seen that with increasing enzyme concentration in the mixture, there was an increase in the enzymatic activity of Alkaline Phosphatase.
Absorption as a Function of Substrate Concentration
Finally, the last part of this experiment was to measure the uptake as a function of substrate concentration, that is, p-nitrophenylphosphate. Table 5 indicates the raw data that was obtained for this part of the work: as can be seen, each of the tubes contains a different amount of substrate, with the zero tubes being the negative control. Figure 5 was plotted from these data and contains five concentration-time dependences as a function of the concentration of the added substrate: as can be seen, the slopes of the graphs are almost the same.
Table 5. Data for experiment #4
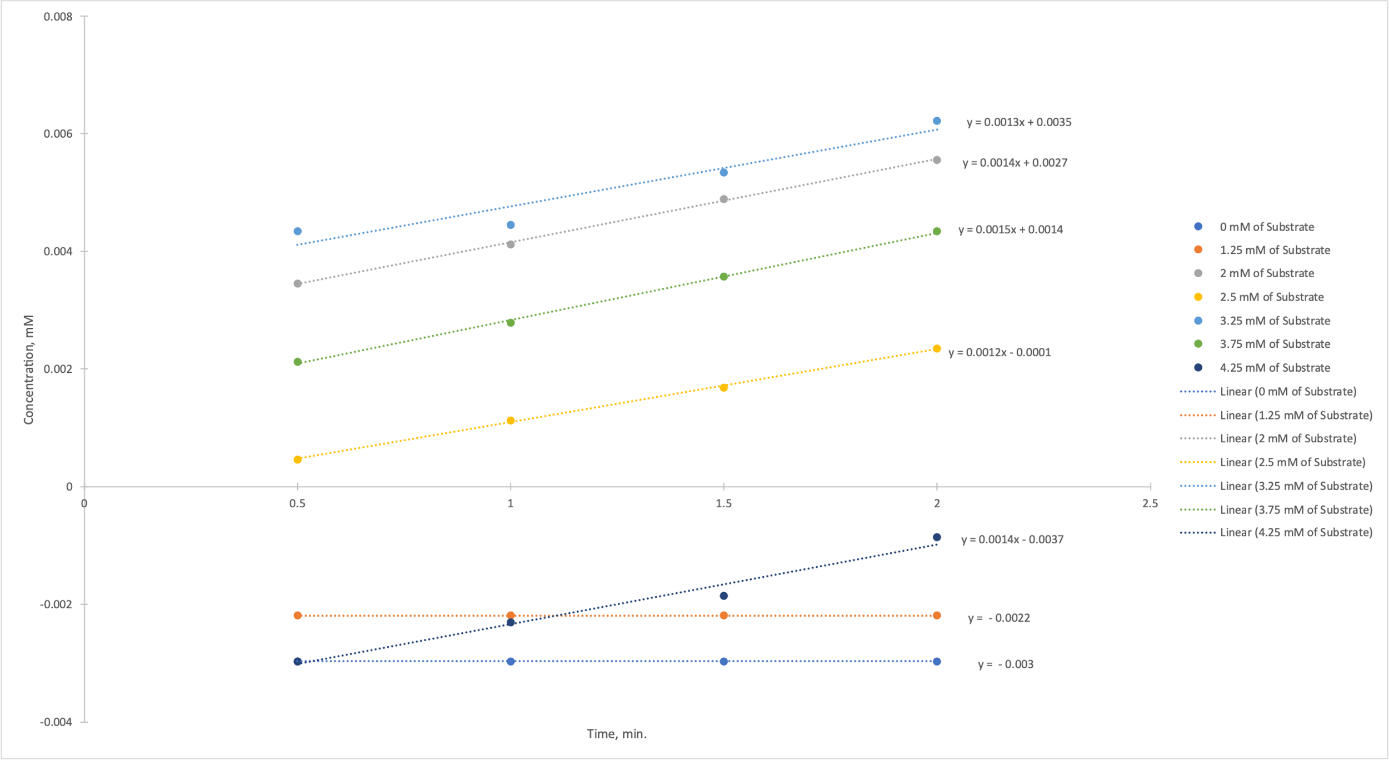
The dependence was plotted for the slopes from Figure 5 and substrate concentrations (Figure 6). It should be emphasized that two starting points (0 mM of Substrate and 1.25 mM of Substrate) were not considered when constructing the graph because they fell out of the linear trend and gave negative enzymatic activity values. The graph shows that with increasing substrate concentration, there was an increase in Alkaline Phosphatase activity.
Enzyme Activity Take-Home Assignment: Lineweaver-Burk Plot
As can be seen from the plot shown above, the y-intercept is 1385.3 min mM-1: considering that this is an inverse value, the real value of the maximum rate of this reaction is 0.00072 mM min-1. At the same time, in experiment #4, the maximum reaction rate (slope) was equal to 0.0015 mM min-1, that is, approximately twice as high. The x-intercept is 0.686: so Kmax is 1.458 mM. Km defines the concentration of the substrate at which the enzyme reaches half of its maximum rate. Checking this value against the graph from experiment #4 (Fig. 6), one can see that half of the maximum rate is reached at a negative substrate concentration, which makes no physical sense.
Discussion
The aim of the present work was to study the enzymatic activity of Alkaline Phosphatase under different manipulations with the enzyme and substrate concentration. No substrate was initially present in the blanks during the experiment because the enzyme would immediately enter into a specific interaction with the substrate, compromising the measurements’ reliability (Schaller, 2022). Therefore, as little time as possible had to elapse between substrate application and measurement. The concentration of the buffer also differed, but this should not have affected the results since the buffer is used to create a soluble medium that does not affect the interaction between the active substances. The overall analysis shows a slow increase in enzymatic activity with increasing substrate concentration; the same was observed with increasing serum volume. However, the rate of increase in Alkaline Phosphatase activity from increasing enzyme volume was more rapid, from which one can conclude that the enzyme is the limiting factor for this reaction. This can also be confirmed by the fact that in the absence of the enzyme, the uptake did not change, that is, no chemical process was observed. It is noteworthy that the rate of the enzymatic reaction decreased over time, which could indicate that the entire substrate was used up or that Alkaline Phosphatase had no free active centers, as may follow from the handout.
Reference
Schaller, C. (2022). Enzyme binding. LibreTexts. Web.