Introduction
Theoretically, the evolution of behaviors amongst organisms’ populations gets necessitated by diverse forces such as genetic drift and natural selection, which alter the rate of occurrence of the alleles in populaces. The change in population over time occurs in reaction to preference to or against a population subclass difference. Natural selection evolution transpires where there is a population variation, and the inherent disparity is heritable and affects survivorship. Conversely, genetic drift evolution occurs due to transmissible population variance (“Evolution and Natural Selection,” 2020). However, survivorship is determined by discrete behavioral traits and alleles rather than the individual variation. Despite evolution being viewed as a steady process, it can practically occur rapidly within protracted periods from slight to imperceptible fruition in between. Hypothetically, any evolution force is anticipated to exhibit a punctuated scheme for the specified system’s conditions. This lab was aimed at simulating the natural selection and genetic drift as well as predicting their frequency of evolution change. The experiment hypothesized that both genetic drift and natural selection have the ability to elucidate the variations in the evolution rates.
Background of the Simulation
The lab employed a fictional population for the simulation of evolution through genetic drift and natural selection. The hypothetical population comprised of beans and the inherent variations characterized by the various assortment of beans. Simulation of natural selection utilized a cup and forceps to extract beans from the environment, where the population regrew in subsequent generations while preserving the existing number of bean varieties after collection. A similar population was utilized for the simulation of the genetic drift. However, the inclination to or against a particular phenotype was ensured through the use of the paper bag and only applying chance in the extraction of individuals from the inhabitant. The simulation simplifications used represented the real happenings in the population.
Procedures
Natural Selection Simulation
Forceps, patterned cloth, and four containers with the various bean varieties were obtained. Then, fifteen specimens of every bean assortment were counted and randomly placed on the simulation environment (patterned cloth) for 60 seconds. Afterward, numerous beans were placed in a cup using the forceps. After 60 seconds, the number of surviving beans, which were outside the cup, were recorded. The population of beans was restored to sixty for the conservation of individual bean variety from the culmination of any generation to the successive one. The process simulated the reversion of innate reproduction to the optimum population proportion. The foregoing steps were repeated for ten generations, and the individual kinds of beans frequency were recorded for every novel generation.
Genetic Drift Simulation
Twelve beans from every assortment were counted, their individual frequency recorded, placed in a paper bag, and shaken thoroughly to ensure uniform mixing of the beans. Six beans were then randomly removed and the remaining number of every bean type in the bag recorded. After that, the population of the beans was reinstated to 48 entities to maintain the original frequency of the individual assortment before the removal. The preceding steps were repeated for ten generations while recording the frequency at the commencement of every fresh round. Finally, the overall process was redone with 12 and 120 beans with every simulation running for ten generations and random removal of six beans per round.
Experimental Results
Data Analysis
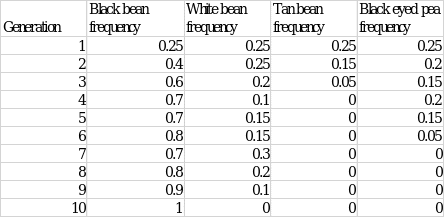
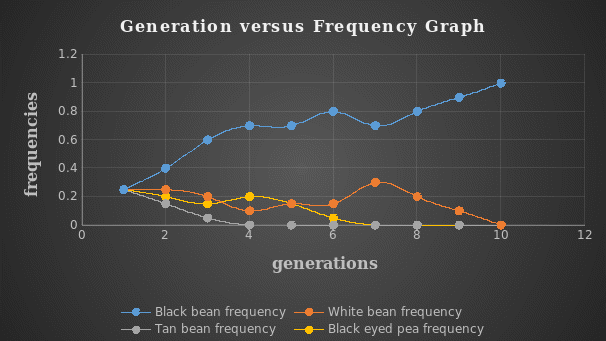
The plot for the generations against the frequencies of the various variety of the beans in natural selection simulation was as follows.
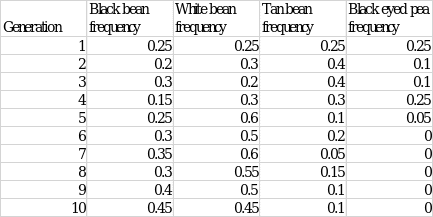
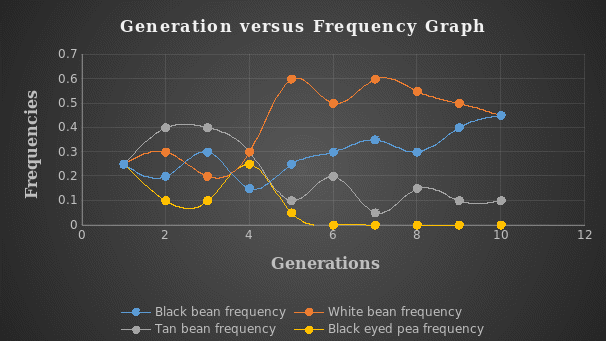
The 12 beans generations-frequencies graph for the genetic drift simulation was plotted as below.
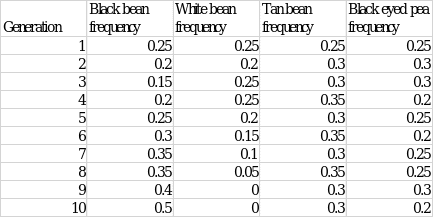
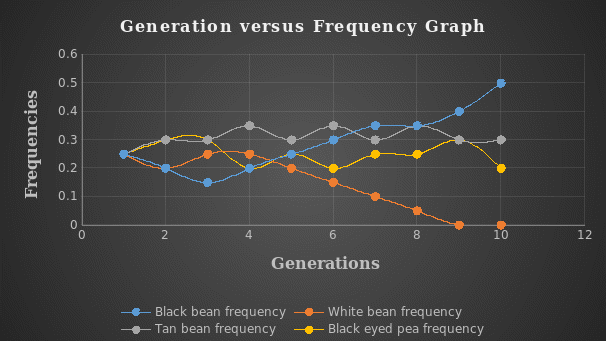
The following graph illustrates the generations-frequencies for the genetic drift simulation using 48 beans.
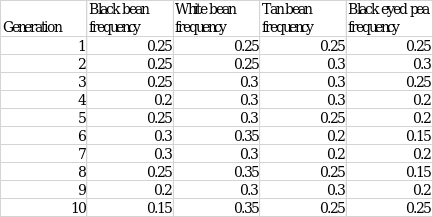
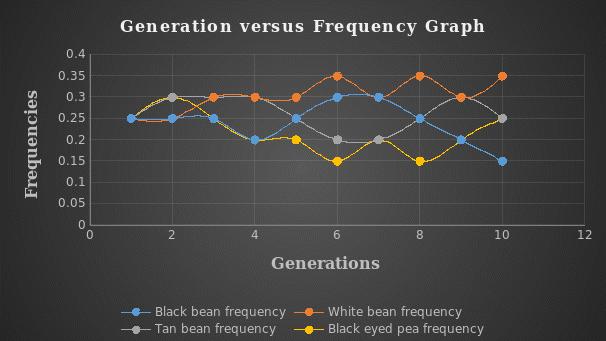
The beneath graph shows the generations-frequencies for the 120 beans in genetic drift simulation.
Discussion
From the natural selection simulation, the allelic frequencies trend discovered more black-bean variety than the white, tan, and black-eyed pea beans within the population across the generations. Additionally, the black beans exhibited exponential changes in frequencies while the other varieties unveiled lessened gradual variations, with the ultimate frequencies being unnoticeable. The observations implied that the evolutionary influences of natural selection promoted the evolution of black beans in successive generations. At the same time, there was no evolution in the other varieties of beans by the tenth generation.
The genetic drift simulation results demonstrated a constant evolution for the medium and large population samples for all the bean assortments. However, with a small population, the black-eyed pea bean variety showed no change in frequency from the sixth generation suggesting that no evolution was taking place. The results indicated that the selection caused a genetic drift in favor of all the phenotypes across all population sizes, except the case mentioned above, where it worked against black-eyed pea beans. Besides, the variance in evolutionary drift between the larger and smaller populations was distinct, with the greater populace displaying higher frequencies for analogous generations.
Conclusion
From the lab results, there were noticeable significant fluctuations in the collected data through natural selection and genetic drift simulations between some successive generations. This could be attributed to the invoked sampling error during the experiment. Nevertheless, the overall analysis depicted a positive trend that genetic drift and natural selection either adversely or positively influence the frequency of evolution amongst organisms. This is further supported by the fact that none of the beans specimens remained with the same number across the ten generations.
Reference
Evolution and natural selection. (n.d.). Lumen Learning. Web.