Introduction
Singapore Telecommunications Limited (Singtel) is the leading telecommunication company in Singapore with revenue of more than $12 billion in the last reported period. The company’s history traces back to 1879, and the country’s telecommunication set up was restructured as a part of its privatization program in 1989 to form Singapore Telecom. Its head office is located in Singapore and has offices in 23 countries across the Asia Pacific, Europe, and the US (“Singtel – Company profile,” 2019).
The Group CEO of Singtel is Chua Sock Koong. The company provides services including “fixed, mobile, data, internet, TV, infocomms technology (ICT) and digital solutions” (“Singtel – Company profile,” 2019). It has just announced its plans to enter the electricity retail market as it signs a deal with Geneco. It has been the outcome of the pressure on the management to diversify its source of revenue like its competitors (“Singtel partners Geneco to offer electricity plans,” 2019).
It went public in 1993 as it floated its 11% shares through an IPO. Another major shareholder is Temasek Holdings. Singtel operated as a monopoly in Singapore until 1996 when the government announced its economic liberalization program and allowed other companies to compete in the telecommunications industry. The company made a significant number of acquisitions and investments overseas, which allowed it to grow substantially and develop business interests internationally as well (“Singtel share history,” 2018). The company’s stock id is Z74, and its current store price is SGD 3.06 as of January 11, 2019 (Bloomberg, 2019). The company reports as a consolidated entity comprising of several subsidiaries including Optus, NCS Pte Ltd, Amobee, and Trustwave Holdings and others (“Singtel – Our subsidiaries,” 2019). Optus is the largest subsidiary operating in Australia and has more than six million subscribers.
Weighted Average Cost of Capital
Weighted Average Cost of Capital (WACC) is the cost of capital or funds that a company has or access to. It is determined as the average of the cost of debt and the cost of equity which is calculated by using the given formula.
WACC = (Market Value of Equity / Firm Value) x Cost of Equity + (Market Value of Debt / Firm Value) x Cost of Debt x (1 – Tax Rate)
Variables Included in the WACC
Market value of equity
The market value of equity is the company’s market capitalization which is calculated by multiplying the number of outstanding shares by its current stock price. The number of outstanding shares of Singtel on March 31, 2018 was 16.3226 billion (“Singapore Telecommunications Limited – Annual report 2018,” 2018). The current share price is SGD 3.06, which shows that the market value of Singtel’s equity is SGD 49.9471 billion. The market capitalization of the company declined in the last year because its share price fell by 15%.
Book value of debt
It is the reported value of the company’s total obligations to debtholders. This amount has to be paid to debtholders before any distribution can be made to shareholders. The cost of debt is calculated by dividing the net interest expense of Singtel by the market value of debt. The company’s short-term debt was SGD 1,823.60 million, and its long-term debt was SGD 8,606.60 million (“Singapore Telecommunications Limited – Annual report 2018,” 2018). It indicates that the total debt of Singtel was SGD 10,4320.20 million on March 31, 2018.
Total firm value
The total firm value of Singtel is the sum of the company’s market value of debt and equity. The total value of Singtel is assessed from its recently reported financial information and is equal to SGD 60.377 billion.
Cost of debt
The net interest expense incurred by Singtel in the year ended March 31, 2018 was SGD 390.20 million as compared to SGD 374.30 in 2016 (“Singapore Telecommunications Limited – Annual report 2018,” 2018). The cost of debt is calculated in the following.
Cost of Debt = Kd = Net Interest Expense / Total Debt
Kd = 390.20 / 10,430.20 = 3.74%
Tax-adjusted cost of debt
The tax rate is the effective tax rate applied to the company’s earnings. Singtel operates in various markets, and its operations are subject to different corporation tax rates. Therefore, the tax rate is determined based on its earnings reported by different subsidiaries. The company’s effective rate was 17% (“Singapore Telecommunications Limited – Annual report 2018,” 2018), which implies that the company’s tax-adjusted cost of debt is 3.74% x (1-17%) = 3.10%
Cost of equity
It is the expected return on shareholders’ investment in the company’s equity. There are two models to estimate the cost of equity namely Gordon’s Dividend Growth Model (DGM) and Capital Asset Pricing Model (CAPM).
Gordon’s Dividend Growth Model (DGM)
This simplest form of this model assumes a constant growth rate for the company’s dividend expected to be paid in the next period. The equation of the constant DGM is given in the following.
KE= (D1/P0) + g
Where, KE= Cost of equity, D1= Expected dividend in a single period, P0 = Current share price, g = dividend growth rate.
CAPM
This model determines the cost of equity based on the systematic risk of the asset. The CAPM equation is given below.
KE= RF + βE (E(RM) – RF)
Where KE= Cost of equity, RF= Risk-free rate, βE= Beta, i.e., an asset’s exposure to systematic risk, E(RM) – RF= Market risk premium (Brigham & Houston, 2015).
The cost of equity of Singtel is calculated by using the CAPM and is determined to be 8.74%.
Results and Analysis
Based on the inputs provided above, the WACC of Singtel is calculated as follows.
WACC = 10.45% x 49,947.1 / 60,377.30 + 3.10% x 10,4320.20 / 60,377.30
WACC = 0.0723 + 0.0054 = 0.0918 or 9.18%
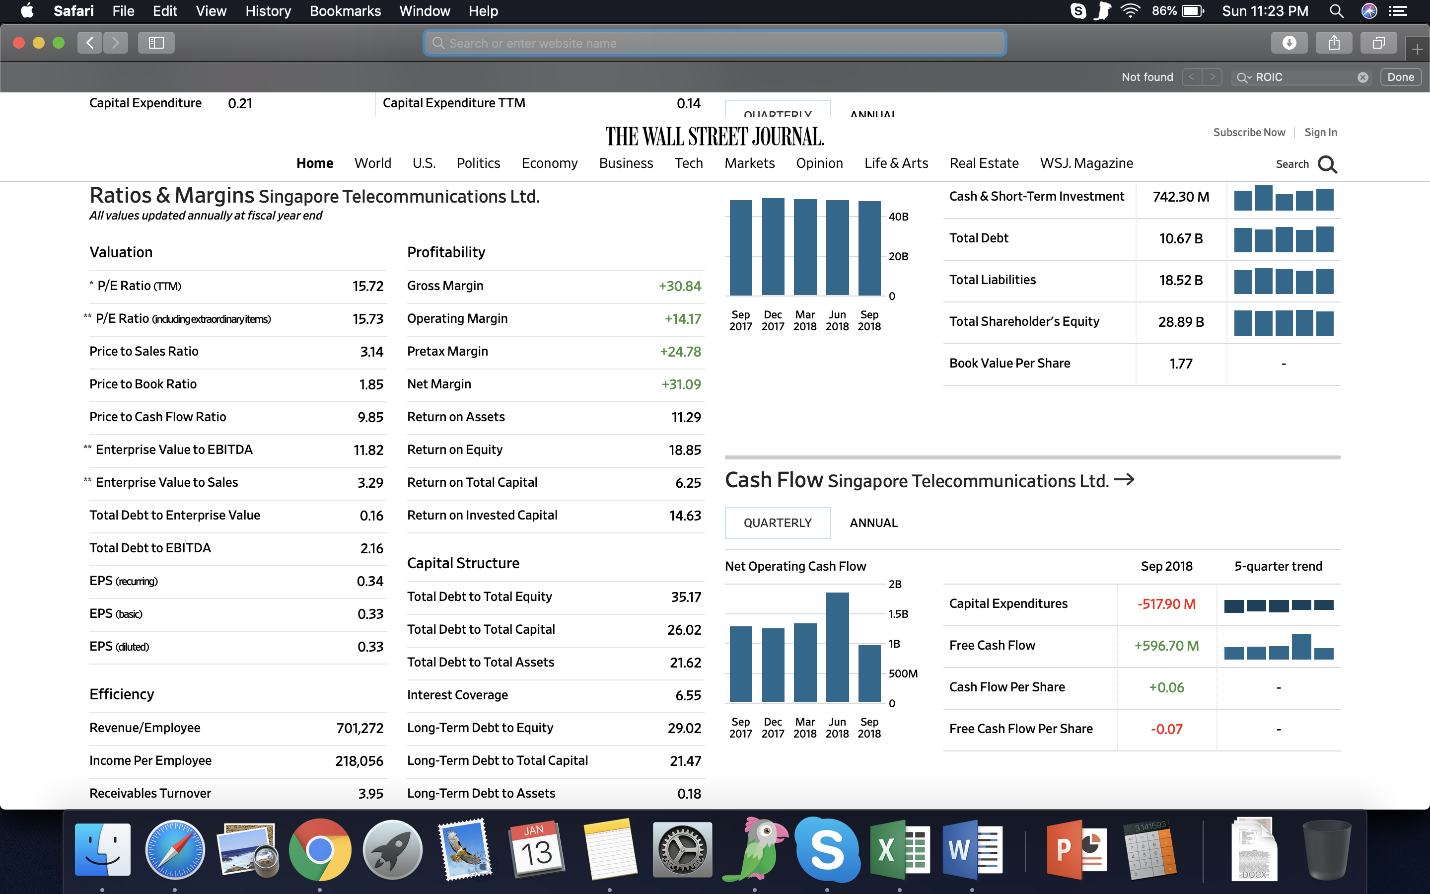
It could be indicated that the company market capitalization is significantly more than the debt value. However, it is noted that the company’s equity shareholders required a higher rate of return as compared to debtholders. Since the cost of debt increased in the last year the company reduced its external borrowing. The WACC of Singtel was 6.41% in 2017 (GuruFocus, 2018), which means that its cost of capital has increased. Moreover, the WACC of 9.18% implies that Singtel must earn more than its cost of capital to generate value for its owners. When compared with its ROIC of 14.63% (See Appendix D), it could be stated that the company was able to generate high value for its shareholders.
Gearing Ratios
The capital structure of Singtel comprises of both debt and equity. The company utilizes these funds to finance its operations and capital investments. It could be indicated that the efficient use of capital is essential to keep the cost of funds low and ensure that the company has sufficient funds for further investment. Table 1 indicates the company’s total assets, shareholders’ equity, total liabilities, and net debt in the last two years.
Table 1. Financial Information.
Debt-to-Equity Ratio. The debt-to-equity ratio is a measure of the company’s financial leverage which is calculated by using the given formula (Rist & Pizzica, 2015).
- Debt-to-Equity = Net Debt / Total Equity
Total Liabilities to Total Equity. This ratio also measures that the extent of financial leverage. In case if the company defaults on its creditor payments, it could face major financial problems (Rist & Pizzica, 2015). The ratio is given in the following.
- Total Liabilities to Shareholders’ Funds = Total Liabilities / Shareholders’ Funds
Equity ratio. The equity ratio is a measure of the proportion of the company’s assets financed by its internal equity (Rist & Pizzica, 2015). It is calculated as follows.
- Equity Ratio = Total Equity / Total Assets
Calculations
The debt-to-equity ratio values of Singtel are provided in Table 2.
Table 2. Debt-to-Equity.
The Total Liabilities to Shareholders’ Funds ratio values are provided in Table 3.
Table 3. Total Liabilities to Shareholders’ Funds.
The equity ratio values are provided in Table 4.
Table 4. Equity Ratio.
Results and Interpretations
Table 2 indicates that the company’s debt-to-equity reduced in 2018. Significant changes were recorded in its bank loans as the company settled its previous loans and acquired new long-term loans. It is also noted that the company had issued long-term convertible bonds. Most of its borrowings will mature between two and five years. The company’s cost of borrowing increased in 2018 as interest rates rose. It could increase financial pressure on the company, and it is advised to reduce its borrowing further.
Table 3 shows that Singtel remained highly leveraged in the last two years. The reason for it was the company’s significant capital expenditure of SGD 12 billion through its different associates and subsidiaries. The company invested almost SGD 2 billion in cash and the remaining it borrowed from debt providers.
Capital Asset Pricing Model
Capital Asset Pricing Model (CAPM) is a model used for estimating the required rate of return on an asset which is based on the association between the expected return on the asset and systematic risk (stock risk or diversifiable risk) (Brigham & Houston, 2015). It implies that investors would expect a high return on assets which have a high risk as they aim to be compensated for taking the risk of losing their money.
Results and Interpretations
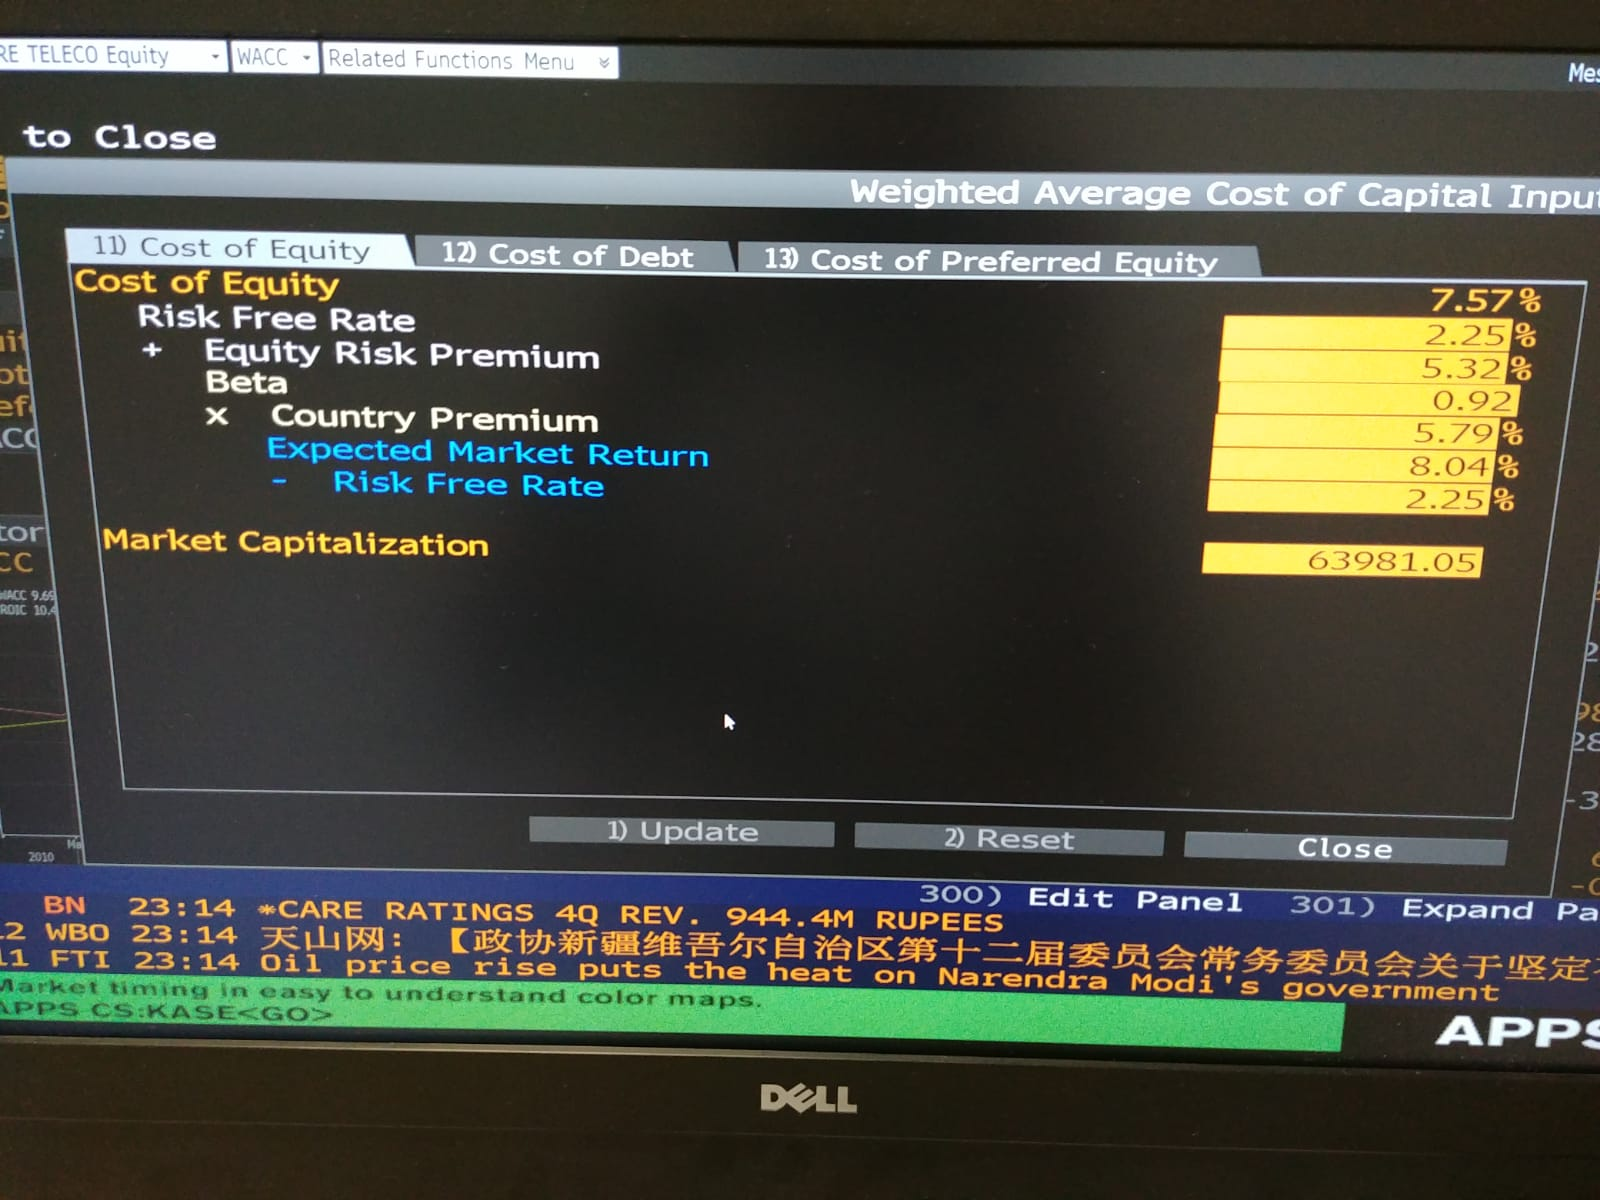
The risk-free rate (RF) of 2.19% is the 10-Year bond rate (Monetary Authority of Singapore, 2019).
Stock Beta = β = 0.74 (See Appendix A)
Equity Risk Premium (E(RM)) = 5.32% (See Appendix C)
Country Premium (CR) = 5.79% (See Appendix C)
Total Equity Risk Premium = 11.11%
Ke = 2.19% + 0.74 x 11.11% = 10.45%
Conclusions
Based on the analysis provided in this report, it could be concluded that Singtel uses both debt and equity to finance its business decisions. The major proportion of its capital structure is equity. However, the analysis indicates that the cost of debt is less than the cost of equity, which means that it is feasible for the company to acquire additional debt. The WACC of Singtel is less than the ROIC, which means that the company had a strong profitability position in the last year.
Recommendations
There could be doubts raised about the efficiency of Singtel’s capital structure because the analysis shows that the cost of equity is much more than the cost of debt. The company could change its capital structure by additional borrowing which will provide a tax shield as high borrowing will result in a high-interest expense deductible from its operating income. The interest cost of the company is much less than its effective tax rate. Therefore, it will improve the company’s profitability but could also have a negative impact on its market capitalization. The implications of this recommendation include weakness of the company’s leverage position.
Reflections
The analysis carried out in this report gave me a chance to learn different concepts related to the investigation of a company’s capital structure. For calculating the WACC, the market value of equity and the book value of debt is used. There would be a difference in the calculation of WACC if different value weights are used. The calculation provided in Appendix B shows that the WACC is higher when the market value is used.
Moreover, 10-year risk-free rate is used. However, if short-term rates are used, then the cost of equity will be less. Singtel’s stock beta is determined by calculating the slope between its stock returns and Dow Jones Singapore Index (SGDOW) in the last one month. The market risk premium is calculated by deducting the risk-free rate from the market return. Finally, interest expense is used for calculating the cost of debt.
References
Bloomberg. (2019). Singapore Telecommunications Ltd. Web.
Brigham, E. F., & Houston, J. F. (2015). Fundamentals of financial management. Boston, MA: Cengage Learning.
Dow Jones Singapore (SGDOW). (2019). Web.
GuruFocus. (2018). Singapore Telecommunications Ltd (OTCPK:SGAPY) WACC %:5.19% As of Today . Web.
Monetary Authority of Singapore. (2019). Singapore government securities – Benchmarks. Web.
Rist, M., & Pizzica, A. J. (2015). Financial ratios for executives. New York, NY: Apress.
Singapore Telecommunications Limited – Annual report 2018. (2018). Web.
Singapore Telecommunications Ltd (STEL) . (2019). Web.
Singtel – Company profile. (2019). Web.
Singtel – Our subsidiaries. (2019). Web.
Singtel partners Geneco to offer electricity plans. (2019). Web.
Singtel share history. (2019). Web.
Appendices
Appendix A – Stock Beta
Table 5. Stock Beta (“Dow Jones Singapore (SGDOW),” 2019; (“Singapore Telecommunications Ltd (STEL),” 2019))
Appendix B – Market Value vs. Book Value
Appendix C – Market Risk Premium
Appendix D – ROIC