The probability or chance of an event occurring is the probability or chance of it happening. In the most straightforward cases, to calculate the likelihood of event A occurring, divide the total number of events by the number of possible outcomes; after obtaining the probability of event A and its corresponding outcomes, divide it with the total number of possible outcomes (Xing et al., 2019). There are various techniques for imagining probabilities, but the most straightforward is to use the part procedure, which involves partitioning the terms by the extent of positive results versus the total number of possible outcomes. Therefore, the result can be the plausibility of an event occurring or not occurring (Xing et al., 2019). The probability of any occurrence is the lengthy relative repeat of that outcome.
The chances are between 0 and 1, including all values within the range. P (A) = 0 denotes that event A will never happen. P (A) = 1 refers to the most well-known occurrence in A. P (A) = 0.5 demonstrates that the occasion A is similarly liable to happen or not happen. For instance, supposing that you flip a fair coin a few times (from 20 to 200 times), the overall recurrence of heads approaches 0.5 (the probability of heads) (the probability of heads).
The standard normal distribution describes data that presents a probability of 0 and 1. It is characterized by rarely occurring naturally; instead, it becomes a reference distribution from which data regarding other normal distributions and the information is available on the distribution table (Weinberg et al., 2020). On the contrary, if X-N (µ, σ 2), “normalizing” is used to process probabilities that include X (X – µ)/ σ is the standard variable. Deducting reduces the mean to zero and then partitioning by scaling the variable to reduce the norm deviation to one (Weinberg et al., 2020). R is a computer program that facilitates the computation of nonstandard normal data. Below is an example of using R to compute nonstandard normal probabilities.
First, one needs to pass the mean and standard deviation to the pnorm task to calculate nonstandard ordinary probabilities in the R console. Allow X to circulate normally with a mean of 100 and a standard deviation of 16. Below are two methods for calculating the probability that X is less than 120 using the R console.
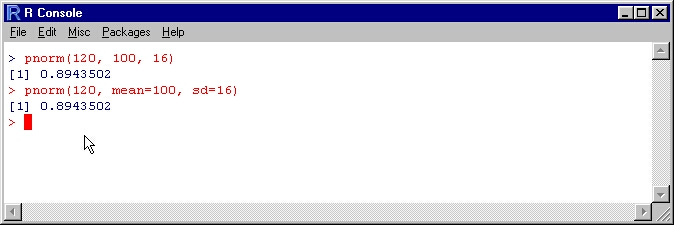
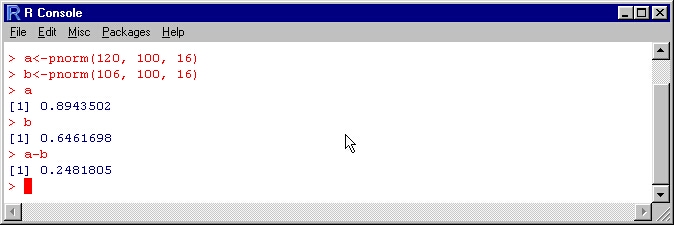
In the most basic scenario, send the data to pnorm in the request: value, mean, and standard deviation. It decides the factors’ upsides and standards in the following situation; thus, the result is the same. Assume that the probability of X falling between 106 and 120 is required to continue with the model. Two methods for performing this calculation are listed below. We request that R deduct the probabilities at the order brief in our initial strategy.
In t next method, ask R to keep all of the probabilities’ upsides and then perform the deduction. To make R contain a value, one must first decide on a “name” for the value and then use sentence structure as indicated below.
Name of value
For example, a<1.23 will store the value of 1.23 in the variable a. a2 (the square of a) will therefore be supplied as 1.5129. The diagram below explains how to complete a nonstandard normal estimating layout.
Using the same example, assuming one needs to know the value of x so that X’s probability is not exactly or equivalent to x is equal to 9. The R package qnorm (a function that calculates boundary value through inverse calculations, X<A) will compute the quantiles for you (Weinberg et al., 2020); the process is similar to pnorm.
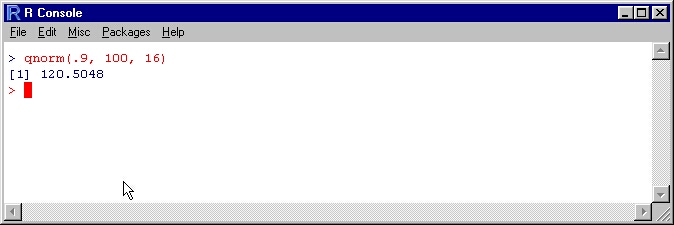
Therefore, if X is an I.Q test score, then 90 percent of the population will score less than 120.5 on this test.
References
Weinberg, S. L., Harel, D., & Abramowitz, S. K. (2020). Statistics using R: An Integrative Approach. Cambridge University Press.
Xing, L., Levitin, G., & Wang, C. (2019). Dynamic system reliability: Modeling and Analysis of Dynamic and Dependent Behaviors. John Wiley & Sons.