Introduction and Purpose
Biodiversity is an important and informative metric that can tell much about ecology. In particular, a high biodiversity level denotes that an ecosystem can positively and effectively perform its main functions (van der Plas, 2019). However, it is a widespread problem when various pollutants significantly harm this phenomenon. Azevedo-Santos et al. (2021) stipulate that the ocean and freshwater systems witness more mediocre biodiversity because of plastic. This state of affairs contributed to detrimental consequences, and the reduced diversity of invertebrates is among them (Azevedo-Santos et al., 2021). That is why the current experiment is conducted to find specific figures demonstrating how a high level of an unknown pollutant affects stream diversity.
Hypothesis
Severe pollution will cause a significantly lower diversity of macroinvertebrates (by species) and result in a reduced Shannon Diversity Index. It is additionally expected that the caddisfly, mayfly, and stonefly will be more sensitive to the pollution, while the worm and black fly will be more tolerant to it.
Methods
The present experiment was performed via a specific online simulation. An appropriate website (http://virtualbiologylab.org/NetWebHTML_FilesJan2016/StreamDiversityModel.html) was accessed to run it and collect the required data. The tool was used to run six simulations (two trials for each of the severe, moderate, and no pollution levels). It was ensured that each of the six trials was performed under the same control variables, including the speed (half-point) and sampling time (250). This tool allowed for measuring the first dependent variable, i.e., species richness. The Biodiversity Calculator (https://virtue.gmbl.se/english-content/biodiversity-calculator) was additionally used to calculate the Shannon Diversity Index, the second dependent variable.
Results and Figures
Each simulation run resulted in a particular number of total species and macroinvertebrates caught. Figure 1 represents a screenshot of Trial 2 for severe pollution. The visual presents the pollution level, species caught, the total number of macroinvertebrates, and sampling time. Each of the six trials had similar screenshots with unique data, and these results were inserted into Table 1 below. In the table, the Species Richness column is informative because it demonstrates the overall number of species found during a simulation. This information denotes that this metric was the highest with no pollution trials (13 and 13 species) and the lowest in severe pollution simulations (8 and 8 species).
Additionally, Table 1 demonstrates that there were many mayflies, caddisflies, and stoneflies when there was no pollution, while these macroinvertebrates were almost absent under severe pollution. The number of black flies and worms significantly increased in highly polluted water. Finally, the last column presents the Shannon Diversity Index, and this value was significantly higher without any pollution in the stream.
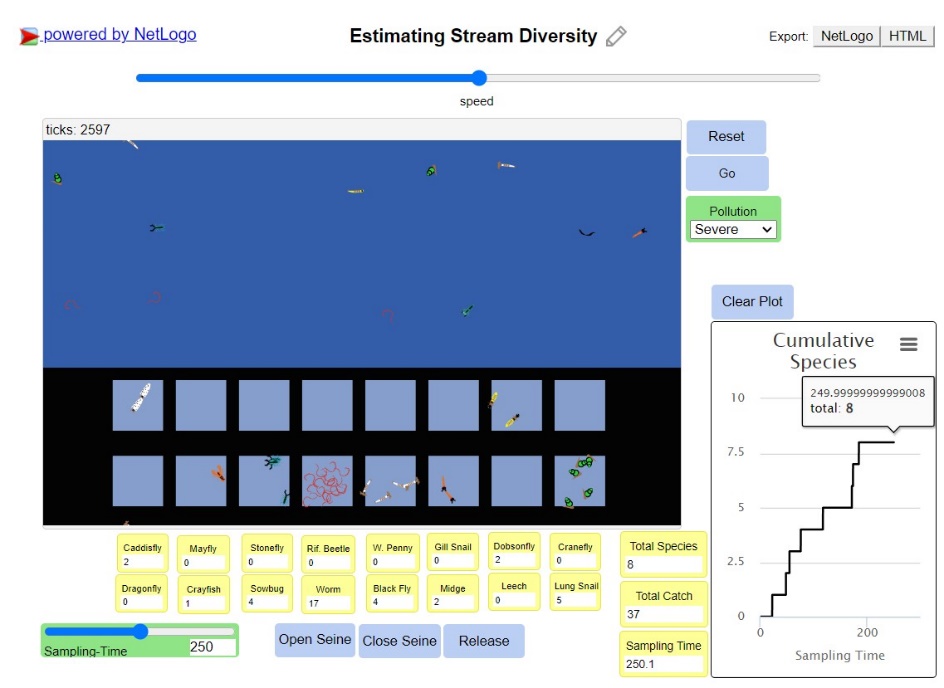
Table 1. Simulation Results.
Discussion
The collected data makes it possible to support the initial hypothesis. The comparison of the Shannon Diversity Index and species richness between the extreme pollution levels generates this outcome. In particular, a high level of pollution resulted in five fewer species and a decrease in the Shannon Diversity Index from 2.299 and 2.385 to 1.612 and 1.68. In addition to that, the obtained data supported the initial suggestion regarding the changes in the total number of individual species. These findings are aligned with the existing literature because Azevedo-Santos et al. (2021) state that high pollution levels hurt the diversity of macroinvertebrates in freshwater. Simultaneously, Singh et al. (2021) mention that a high number of warms is a major indicator of polluted water. In conclusion, the given experiment is a perfect activity to understand and visualize the impact of severe pollution on stream biodiversity. No problems were detected, which denotes that it is not necessary to change or improve the experiment.
References
Azevedo-Santos, V. M., Brito, M. F., Manoel, P. S., Perroca, J. F., Rodrigues-Filho, J. L., Paschoal, L. R., Goncalves, G. R. L., Wolf, M. R., Blettler, M. C. M., Andrade, M. C., Nobile, A. B., Lima, F. P., Ruocco, A. M. C., Silva, C. V., Perbiche-Neves, G., Portinho, J. L., Giarrizzo, T., Arcifa, M. S., & Pelicice, F. M. (2021). Plastic pollution: A focus on freshwater biodiversity. Ambio, 50(7), 1313-1324. Web.
Singh, A. K., Kumar, A., Bilal, M., & Chandra, R. (2021). Organometallic pollutants of paper mill wastewater and their toxicity assessment on Stinging catfish and sludge worm. Environmental Technology & Innovation, 24. Web.
Van der Plas, F. (2019). Biodiversity and ecosystem functioning in naturally assembled communities. Biological Reviews, 94(4), 1220-1245. Web.