Introduction
Sales data can be insightful in informing business organizations about their business performance. The Superstore sales data provides information on order dates, products sold, the market’s geographic locations, and profits from sales. Visualizing the dataset is crucial for understanding how Superstore’s products perform in the global market and for identifying the specific strategy the organization can take to maximize its performance. This paper presents a visualization of the dataset to identify the most profitable product, the state with the highest sales, and the most ordered product category.
State Sales Performance
The provided dataset shows that Superstore supplies its products to various States in the U.S. While the organization appears to have penetrated all States, understanding the performance of each is insightful. This allows the firm to maximize profitability by increasing sales in the States that purchase the most of its products (Jani et al., 2023). Figure 1.0 shows the total number of products that the company supplies to different States in the U.S.
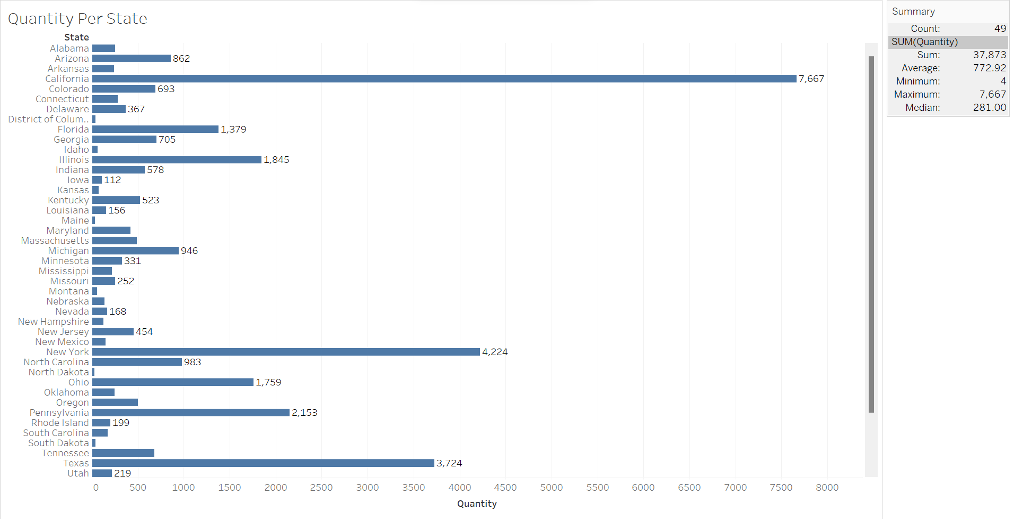
According to Figure 1.0, the State of California is the largest market for Superstore products, with 7,667 items sold. On the other hand, the State of Wyoming is the smallest, with only 4 items being sold to that market. Other best-performing states are New York (N=4,224) and Texas (N=3,724). The insights suggest that the organization should improve its marketing strategy in the State of Wyoming (Varadarajan, 2020). Meanwhile, the firm can maximize profits in New York and Texas by developing more innovative products that better attract the market.
Products’ Profitability
Determining individual product profitability is central to managing the inventory and adopting marketing strategies. While Superstore sells over 1,000 products, some are more profitable than others. Figure 2.0 shows a packed bubble chart that visualizes the profits made from the store’s major products. The graph was chosen because it could visually accommodate all the products on sale at the store.
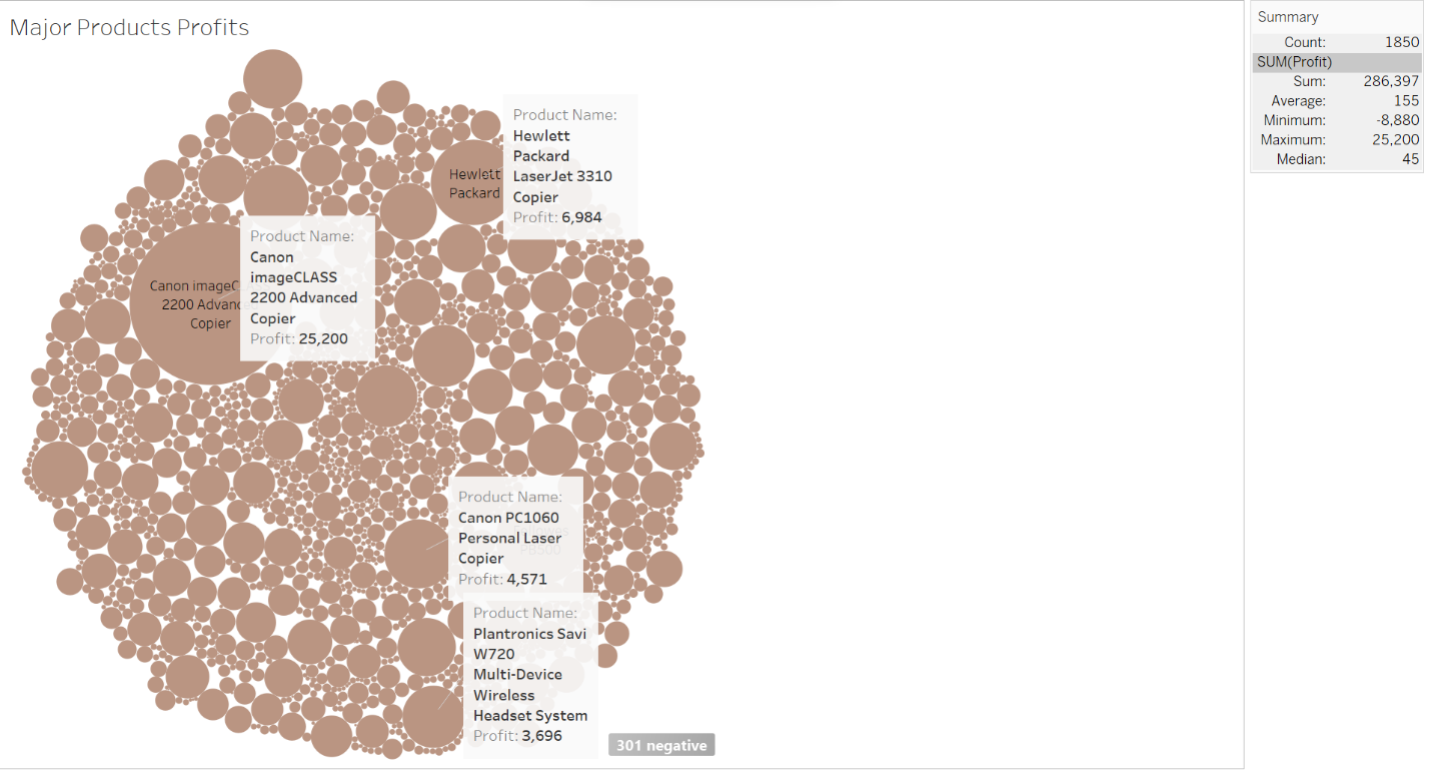
From Figure 2.0, the Canon imageCLASS 2200 Advanced Copier has the highest profit of $25,200. Meanwhile, the second-most-profitable product is the Hewlett-Packard LaserJet 3310 Copier, at $6,984. The other products generate profits as low as -$8,800, which can be unsustainable for the store. Therefore, the products with the highest profits should be increased while those that attract losses should be reduced (Varadarajan, 2020). The latter strategy will help the Superstore increase its overall profits, remaining sustainable.
Most Ordered Product Category
The provided dataset shows that the store has 17 product subcategories. The products’ sales volumes allow an organization to determine its profitability and operational efficiency (Varadarajan, 2020). Figure 3.0 shows how the various product subcategories performed in terms of sales volume. The summary table shows that the store sold a total of 37,873 items from all the sub-categories.
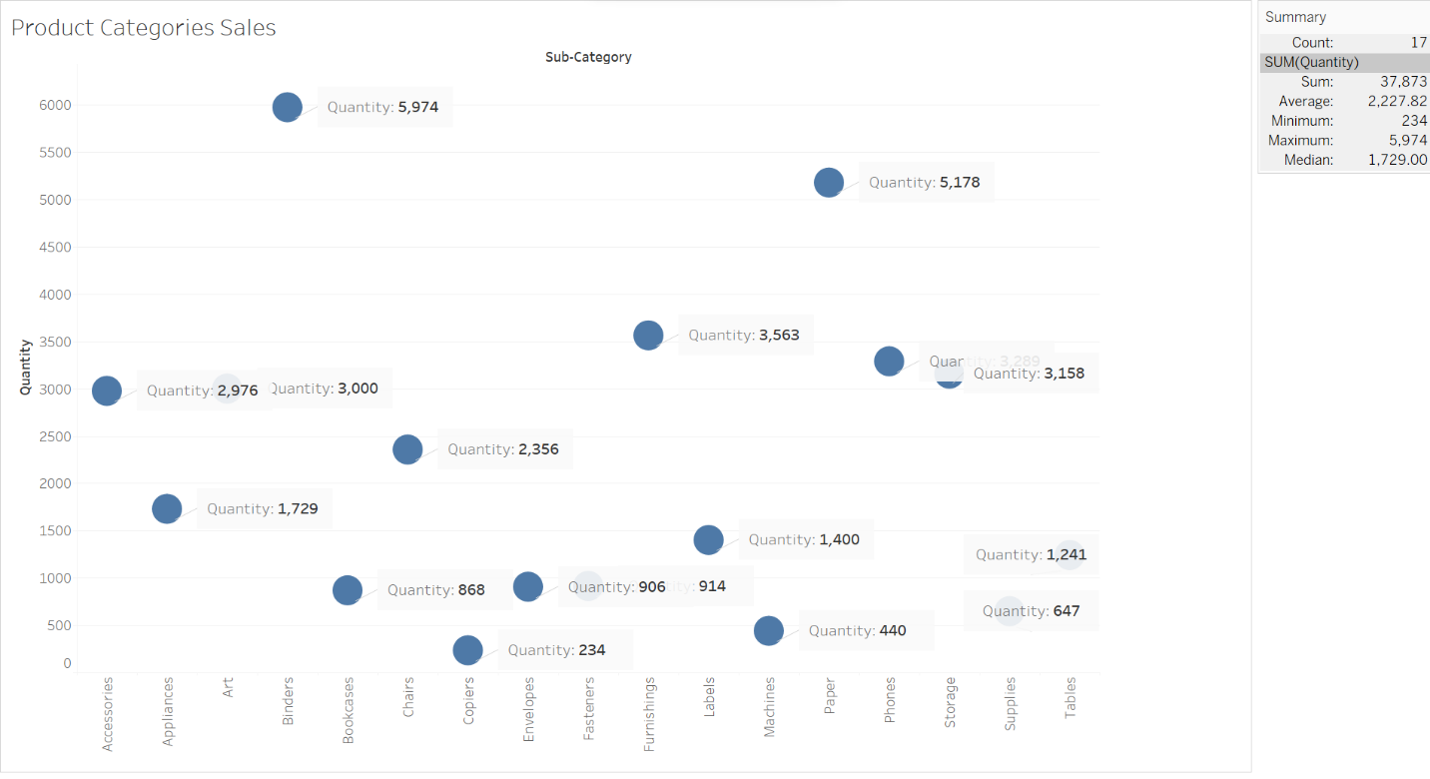
From Figure 3.0, binders (N=5974) were the most sold product sub-category while copiers (N=234) were the least. Other best-performing sub-categories were papers (N=5,178), furnishings (N=3,563), and phones (N=3,289). The stores’ profits would increase if the adopted market strategy focused on the least-selling products, such as copiers (Varadarajan, 2020). Therefore, the store needs to research why some products perform better than others for improved sales volume in the future.
Conclusion
Tableau was used to visualize the Superstore dataset using various graphs. The bar chart in Figure 1.0 shows that California records the highest Superstore sales. Meanwhile, the packed bubble chart in Figure 2.0 shows that the most profitable product is the Canon imageCLASS 2200 Advanced Copier. Upon visualizing the sales volume for each product sub-category, binders were the most sold, and copiers the least.
References
Jani, M. Y., Betheja, M. R., Chaudhari, U., & Sarkar, B. (2023). Effect of future price increase for products with expiry dates and price-sensitive demand under different payment policies. Mathematics, 11(2), 263.
Varadarajan, R. (2020). Customer information resources advantage, marketing strategy and business performance: A market resources-based view. Industrial Marketing Management, 89(1), 89–97.