Introduction
Tensile test is one of the most common mechanical testing procedures for materials. This is among the simplest procedures and provides lot of useful properties of materials like Young’s Modulus or Stiffness, Proportional Limit, Elastic Limit, Yield Strength, Ultimate Tensile Strength, True Fracture Strength, Uniform Elongation or Elongation until Necking, Total Elongation before Fracture, Strain Hardening Coefficient, Reduction in Area, Resilience and Tensile Toughness. Besides, from tensile test one also gets a good idea about the yielding behavior of a material. Thus one gets lot of information pertaining to a single test and these are very useful information about strength and ductility and formability of a material. At the same time one must realize that tensile test is a destructive test as the material that is used for this test is fractured in the course of this test, therefore, this test is carried out on representative samples of a material and the result of the test is applicable for all the material of that batch. Subsequent sections will briefly describe the test procedure and then our findings on tensile test of plain carbon steel will be presented and discussed.
Tensile Test of Materials
Tensile test of materials is carried out as per different ASTM standards. These standards provide sample geometry. Samples are either of rectangular / square or circular cross-sections consisting of gage-length and head. The gage length is the region of uniform cross-section and the cross-section is the least in this region. Tensile test is performed in either an Instron Machine or a Universal Testing Machine. These machines have provision to rigidly hold the specimen in its cross-heads. The tensile specimen is held in its head region and then one of the cross-heads is kept fixed while the other cross-head is moved at a predetermined speed. Thus the tensile specimen is given a known extension and the load required to give this extension is recorded. The specimen is pulled (by moving the cross-head) till it fractures. Thus one gets a Load-Extension plot from tensile test. This is the raw data from a tensile test, which is then processed to get engineering stress-strain curve and true stress-strain curve. One derives a variety of useful properties of the material. There have been considerable improvements in the control over cross-head movements and load measurements. While strain can be derived from measurements of the cross-head movement, this measurement is not accurate enough for measuring Young’s Modulus of the material and for that purpose there is a better method of using strain gage. This works on the principle of changing electrical resistance with length and this is attached on the gage section of the tensile specimen for measuring strain.
While cross-head speed is kept at a value corresponding to a strain – rate of 10-3 in standard tests; one can also carry out non-standard tests in which one can keep strain rates much smaller 10 -6 to 10-5. Such tests are performed for extremely brittle materials.
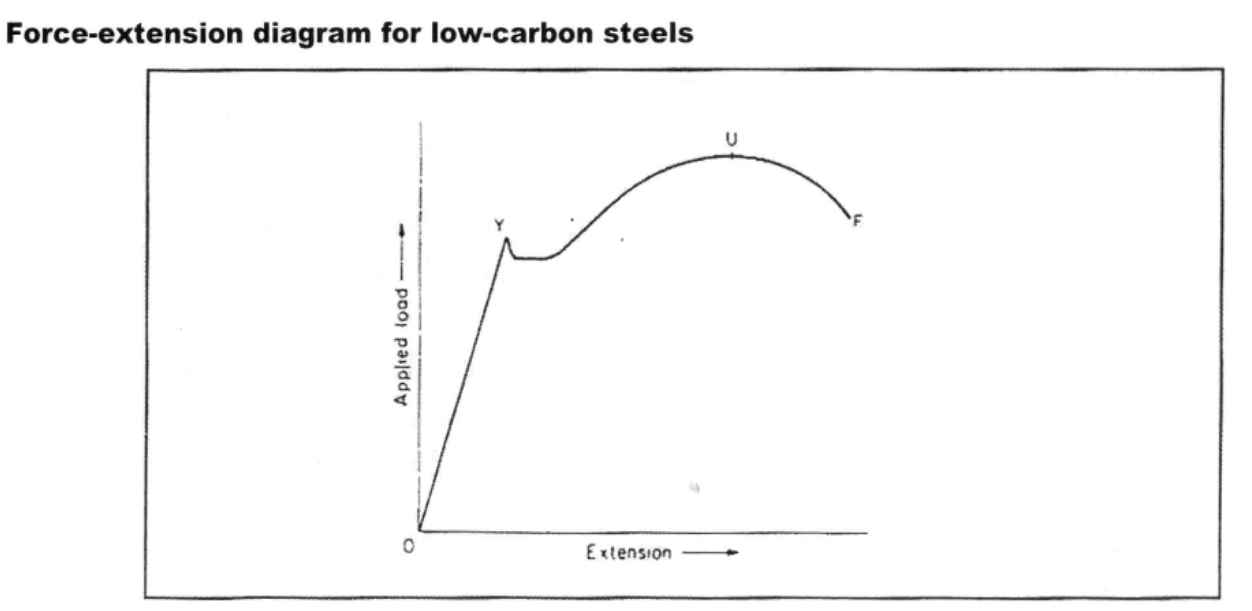
The nature of the load-extension plot is dependent on the material. This can be of different type depending on the material. However, there are two prominent plots – one for plain carbon steel and another for non-ferrous materials like aluminum, copper ets. The load-extension plot of plain carbon steel is shown in Fig. 1 below. In this picture one can clearly see the yield point as this is a sharp point and there is a drop in the load required for further yielding, once yielding process has begun. Thus in case of plain carbon steels it is pretty easy to determine the yield strength.
However, it is not so in case of non-ferrous materials like aluminum, copper and their alloys. This is because, these materials have a smooth load – extension plot (Fig. 2) and it therefore, it is not easy to identify the yield point by looking at the chart.
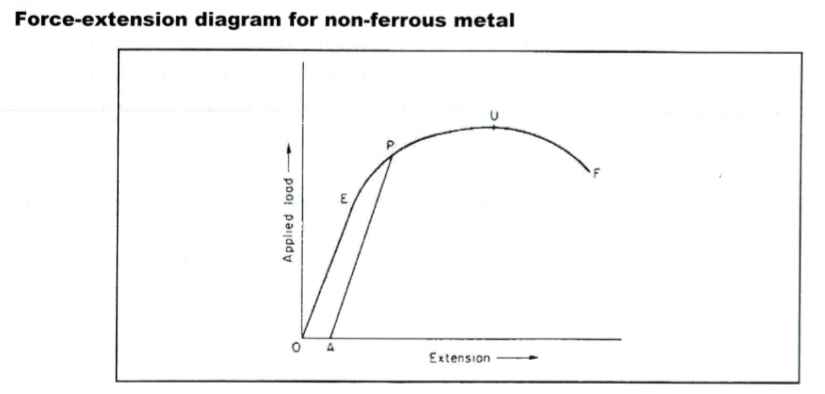
Therefore, a standard procedure (ASTM Standard E 8-69) has been adopted for determining yield strength of such materials. The procedure is briefly described below.
- Determine the engineering stress –strain curve from the load – extension plot by normalizing load with the original cross-sectional area of the sample in the gage region (this gives engineering stress) and the extension by the original gage length of the specimen (this gives engineering strain).
- A line parallel to the elastic portion of the stress – strain curve with an offset of 0.2% strain is drawn.
- The point of intersection of the offset line with the engineering stress – strain curve is taken as the yielding point and the corresponding stress value is taken as yield stress.
The ultimate tensile strength of the material is determined by dividing the maximum load with original area of cross – section of the tensile specimen. Two important measures of ductility – %Elongation and %Reduction in area are also determined. For calculating %Elongation the extension till fracture is divided by original gage length of the tensile specimen. This is confirmed by measuring the final length of the gage section of the tensile specimen by assembling the broken pieces after the test. Also , the minimum cross-section area near the fractured end is measured and %Reduction in area with respect to the original area of cross – section of the tensile specimen is calculated. This is also a very important measure of ductility of the material being tested.
In this report the findings of tensile test of plain carbon steel and aluminum is presented.
Experimental Procedure
Tensile specimen of circular cross-section of Aluminum alloy (Code T), Low carbon (0.1 wt%) steel (code A), Medium carbon (0.4 wt%) steel (code D) and High carbon (0.8 wt%) steel (code N) were used in these experiments.
Gage length and area of cross – section in the gage section were measured using a vernier caliper. Multiple (3) measurements were made, average value was taken and the same was recorded in the data book.
The tensile specimen was held in the grip and then loaded into the machine.
The tensile sample was tested as per ASTM procedure till fracture.
Load – Extension plot was recorded.
After the tensile specimen was fractured, it was taken out, assembled and the length of the gage section was measured and recorded.
Diameter of the broken piece near the fractured end was also measured and recorded.
Results
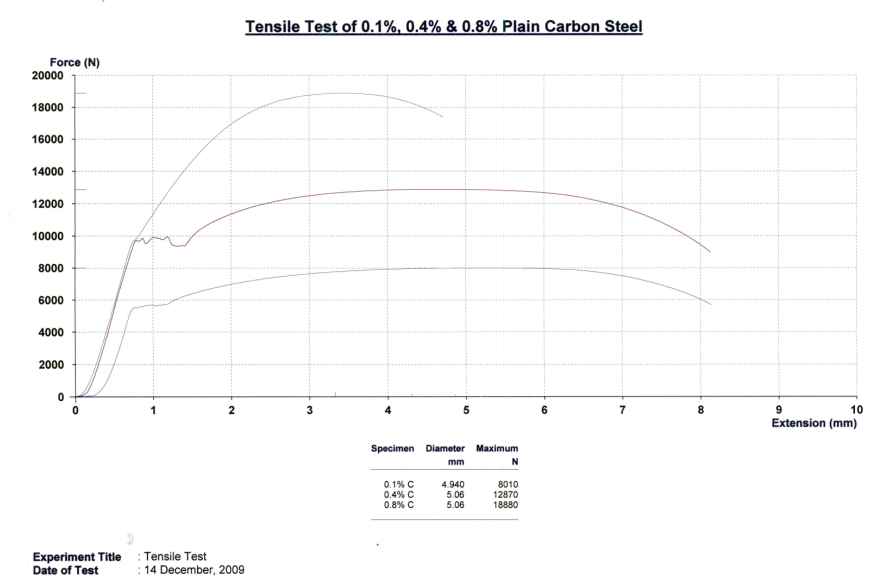
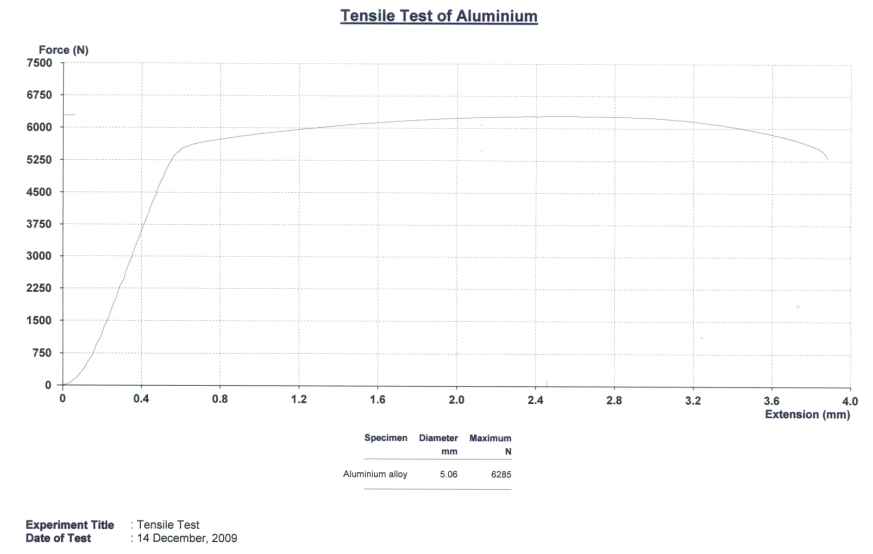
The load – extension plots for plain carbon steel and aluminum alloy are presented in Fig. 3 and Fig. 4 respectively.
For Steel Specimen
For 0.1% C-steel
- Original Gage Length (Lo): 25.45 mm
- Final Gage Length (Lf): 33.55 mm
Therefore, %Elongation = [(Lf – Lo)*100]/Lo = 31.8%
- Original Diameter (Do): 4.94 mm
- Original Area of Cross-Section (Ao): 19.16 mm2
- Diameter at Fracture End (Df): 2.62 mm
- Final Area of Cross-Section (Af): 5.39 mm2
Therefore, %Reduction in Area = [(Ao – Af)*100]/Ao = 71.9%
- Load at Yielding = 5650 N
Therefore, Yield Strength YS = 5650 / 19.16 MPa = 295 MPa
- Maximum Load = 8010 N
Therefore, Ultimate Tensile Strength UTS = 8010 / 19.16 MPa = 418 MPa
Similarly,
For 0.4% C-Steel
- %Elongation = [(Lf – Lo)*100]/Lo = 31.7%
- %Reduction in Area = [(Ao – Af)*100]/Ao = 71.5%
- Yield Strength YS = 5650 / 20.1 MPa = 488 MPa
- Ultimate Tensile Strength UTS = 8010 / 20.1 MPa = 640 MPa
For 0.8% C-Steel
- %Elongation = [(Lf – Lo)*100]/Lo = 18.2%
- %Reduction in Area = [(Ao – Af)*100]/Ao = 35.1%
- Yield Strength YS = 5650 / 20.1 MPa = 542 MPa
- Ultimate Tensile Strength UTS = 8010 / 20.1 MPa = 940 MPa
For Aluminum Alloy
- %Elongation = [(Lf – Lo)*100]/Lo = 15.4%
- %Reduction in Area = [(Ao – Af)*100]/Ao = 43.8%
Load at 0.2% proof stress was determined by drawing a line parallel to the elastic portion of the load – extension plot at an offset of 2.5 mm (0.002 of gage length 25.25 mm, which is then multiplied by 50 to take care of the scale on x-axis). The load corresponding to 0.2% proof stress was thus determined to be 5600 N.
Therefore,
- Yield Strength YS = 5600 / 20.1 MPa = 278 MPa
- Ultimate Tensile Strength UTS = 8010 / 20.1 MPa = 312 MPa
These values are summarized in Table 1, below.
Table 1: Tensile Properties of C-Steel and Aluminum Alloy
Discussion
It can be seen from the load – extension plot as well as from the calculated values of tensile properties of c-steels (listed in Table 1) that carbon content has significant impact on tensile properties of plain carbon steel. The yield as well as the ultimate tensile strength is increasing with increasing carbon content. This happens because, increasing carbon content leads to formation of more of iron carbide (Fe3C) also known as cementite. This is a hard and brittle phase. This forms as colonies of ferrite (a-iron) and cementite lamellae (This combination of cementite and a-iron is known as pearlite). Therefore, increasing carbon leads to increasing proportion of hard and brittle phase and therefore, strength increases and ductility decreases.
When a material is loaded, it generates a response to counter the applied load and two kind of mechanical response is produced – stress and strain. While stress equals load divided by the area of cross-section, it should be borne in mind that stress is not something external rather it is something produced internally in the material to keep its constituents (atoms at microscopic level) together with minimal displacement. Thus stress in a material is produced by the interatomic forces trying to keep the atoms together while they are being pushed apart by the applied load. It should be noted that there is a limit upto which a component can counter the applied load by stressing itself without undergoing any irreversible shape change. If the applied load demands more stress in the material than the material can accept, then the material yields thus undergoes irreversible shape change. By doing so the material strengthens itself (work hardening) which gives it capability to take more stress and counter the applied load beyond the yield point. But there is a limit, it can take no more than its true fracture strengths and if the applied load forces it to take still more stress, it simply fractures. The change in shape (also size to some extent) produced by the external load with respect to the original shape normalized by the original shape is what is the strain. These are important parameters in engineering and design of components. A designer must know how much stress a material can take without yielding or fracturing so that he can design components. He should also know how much strain a material can take before, it fractures so that he can design a component without the fear of catastrophic failure.
There parameters are also important for processing of material as well. During processing like rolling, forging, bending etc. lower strength and higher ductility is required so that processing can be done by using lesser force and thus lesser energy.
Yield stress is the stress level in the material at which it begins to yield at measurable scales. For many materials like plain carbon steel, this point is distinctly visible on charts. This is because, in these materials it requires more load to initiate yielding than to sustain yielding. Thus one finds a drop in the load value immediately after the yield point.
In case of certain materials like aluminum alloys, the load – extension plot and therefore, engineering stress – strain curve is smooth and it is difficult to determine the yield stress without confusion. Therefore, one standard procedure is followed, in which a line parallel to the elastic region of the stress-strain curve is drawn at 0.2% offset strain and the point at which this offset line intersects the engineering stress – strain curve is taken as proof stress.
These values are of great importance to component designers as the design is based on these values plus safety margins required by the applicable codes.
Conclusions
From these experiments it can be concluded that tensile test is very useful for deriving very useful properties of materials like yield strength, ultimate tensile strength, %Elongation and %RA. In case of plain carbon steels, the yield point is distinctly clear on the load – extension plot, while the same is not the case for aluminum alloy. Therefore, 0.2% proof strength was determined for the aluminum alloys. It can be also concluded from these experiments that strength increases and ductility decreases for plain carbon steels with increasing carbon content.
References
Hertzberg R. W. “Deformation and Fracture Mechanics of Materials” Ch. 1
Higgins R. A. “Properties of Engineering Materials” Ch. 4
John V. B. “Testing of Engineering Materials” Ch. 3
Jordon J. E., “The New Science of Strong”, Ch. 2