Abstract
The paper carried out financial evaluation of Tesco PLC. The company is a market leader in the UK retail industry. The retail industry is in the UK is quite vibrant and it contributes significantly to the economic success of the country. Based on the analysis in the paper, it can be observed that the company has the highest percentage of market share. Further, analysis of stock market activity shows that share prices of the company are quite volatile. Also, the company pays a constant interim and final dividend. Finally, ratio analysis shows that the company performed dismally in relation to the industry averages.
Overview of the company and industry
Company
Tesco PLC is a multinational company that is based in the United Kingdom. It is a public limited company that trades on the London Stock Exchange. The company operates in the retail industry. Jack Cohen founded the company in 1919. During this period, it operates as market stalls within London (Tesco PLC, 2014). It has tremendously grown over the years and currently, it ranks second in the world after Walmart. The company operates in 12 countries worldwide. Some of the regions where it operates are the United Kingdom, China, India, Malaysia, Korea, Hungary, Poland, and Ireland among others. The company has 3,146 stores in the UK, 2,131 in Asia, and 1,507 stores in Europe (Tesco PLC, 2014). The main subsidiaries of the group are Tesco Mobile, Tesco Bank, and Tesco Stores Ltd. Finally, it has engaged more than 530,000 employees across the world. The paper seeks to carry out financial analysis of Tesco PLC. The paper will discuss the industry in which the company operates, stock market activity, and ratio analysis.
Industry
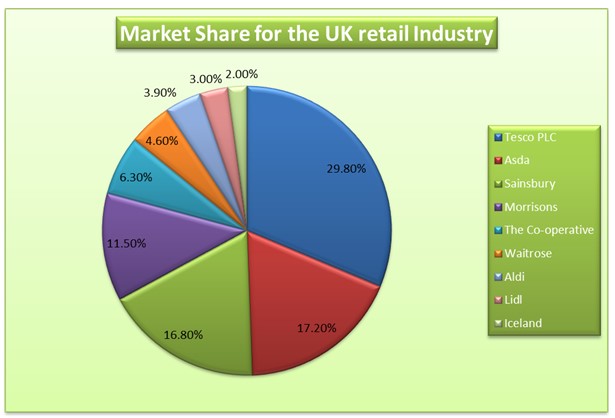
The retail industry in the United Kingdom is quite competitive because it is made up of all companies that sell goods to consumers. As at the end of 2013, there were about 428,000 businesses in the sector. The industry employs about 4,236,000 people and it contributes about £152 billion in terms of output to the GDP of the UK in a year. Internet sales is shaping the speed of growth of companies in the UK retail industry. There has been significant growth in the UK online retail expenditure. In 1998, the value of the expenditure was £0.4 billion (Tesco PLC, 2013). The value rose to £29.6 billion in 2012. Thus, companies in the industry have made massive investment in internet sales so as to maximize their market share. It can also be pointed out that economic swings affect the profitability of the company in the industry. For instance, the economic meltdown experienced at the end of 2008 slowed down consumer spending and this affected the companies in the retail industry negatively (Tesco PLC, 2013). The table presented below shows the market share of key players in the UK retail industry.
The table shows that the top companies in the industry such as Tesco, Asda, and Morrisons lost market share to the small companies in the industry such as Aldi and Lidl. The loss in the market share can be attributed to aggressive campaigns used by companies such as Aldi. Such advertisements target the customers in upmarket segment. Besides, such companies have opened more stores in regions where the competitors operate. The pie presented below shows the proportion of the market share for the year ended 2013.
Analysis of stock market activity
This section will analyze the stock market activity for the company for a period of three years. The start date for the analysis is 1st March, 2011 and the end date is 5th March 2012. The dividends are included in the share prices used to construct the graph. The graph presented below shows the trend of share prices of the company during this period.
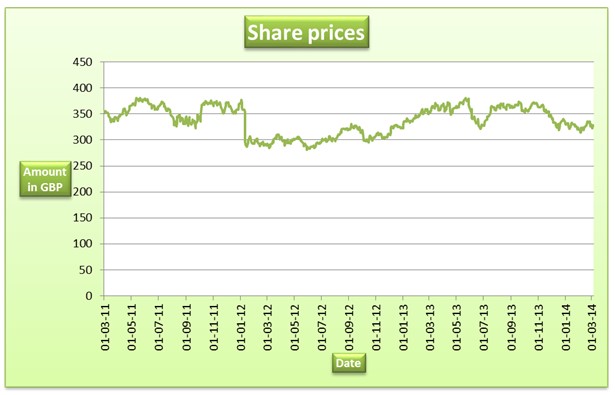
Currently, the shares of the company are trading at 327.5p per share. The share prices of the company have been quite volatile during the past three years as depicted by the trend in the graph above. The company reported a slow growth in the share prices between March, 2011 and January, 2012. Thereafter, the share prices declined between January, 2012 and December, 2012 thereafter, they began to rise. The trend in the share prices can be attributed to the volatile economic conditions. Most countries have not yet fully recovered from the 2012 economic meltdown. The economic conditions have made consumers to change their consumption behavior. This makes the companies in the retail industry not to effectively predict consumer behavior. In the graph, it can also be pointed out that the share prices were maximum during Christmas. However, the share prices did not rise as anticipated due to the change in consumption pattern. Industry surveys show that the consumers are turning away from consumption of luxury goods. The stock market activity also depends on the volume of sales and profitability. Over the past three years, the sales revenue earned by the company did not meet expectations. The company reported a decline in sales from the local and some international markets. For instance, sales generated from the UK market in 2013 fell short of the company estimates by 2.4%. This too contributed to the slow growth in the share prices of the company. The decline in profitability contributed to the volatility in share prices (Tesco PLC, 2013). The table presented below shows the dividend paid by the company during the same period.
The table indicates that the company pays interim and final dividend. The full year dividend increased from 14.72p in 2011 to 14.76p in 2012 and 2013. It can be observed that despite the decline in sales, competition, and a decline in market share, the company maintained the amount of full year dividend it pays to the shareholders. The dividends paid indicate that the company maintains a constant dividend policy irrespective of the profit earned by the company (Tesco PLC, 2013).
Ratio analysis of the company and the industry
This section will focus on ratio analysis of the company. Various ratios will be calculated and later compared with the industry averages. End of year values will be used in the calculations.
Liquidity ratios
The liquidity ratios for the company were quite low. The current ratio ranged between 0.67 and 0.69 during the period while the quick ratio ranged between 0.48 and 0.50. The values of the liquidity ratios are less than one. This implies that the company is facing difficulties in paying current liabilities using current assets. This implies that the company is facing difficulties in paying accounts payable on time and it may as well borrow from financial institutions to support its liquidity. The industry average for the current ratio is 1.48 while for quite ratio is 0.44. The low ratios can be attributed to the nature of the commodities that the company trades in (Brigham & Houston, 2009). The current ratio for the company was lower than the industry average, while the quick ratio was higher than industry average. Thus, the company needs to improve on the liquidity position.
Asset management ratios
The inventory turnover ratio declined from 19.12 in 2011 to 17.31 in 2013. This implies that the number of times that the company replaces stock in a year declined. Further, it can be noted that the ratios are higher than the industry average (14.0). It is a good indication because it implies that the company holds less inventory. The days sales outstanding ranged between 13.97 and 20.35. The ratio gives information on the average period of time it takes the firm to collect accounts receivables. The industry average for days sales outstanding is 4.52. This implies that the company takes a longer period to collect accounts receivables than its peers (Brigham & Houston, 2009). The fixed asset turnover ratio rose from 2.48 in 2011 to 2.61 in 2013. The increase shows that the amount of sales generated from a unit of fixed asset increased. However, the ratios are lower than the industry average of 4.09. This implies that the company performed dismally. Finally, the total asset turnover ranged between 1.27 and 1.29. The ratio estimates the amount of sales generated from a unit of total asset. The ratios are lower than the industry average of 2.28 and it implies that the company performed dismally.
Debt management ratios
The debt to equity ratio gives information on the percentage of total assets that is financed by debt. The ratio declined from 23.46% in 2011 to 21.61% in 2013. A low ratio shows that the leverage level is low. The industry average is 49.6% and it implies that the leverage level of the company is lower than the industry average. The interest coverage ratio ranged between 4.77 and 10.18. The low ratio that was reported in 2013 can be attributed to the low profit. It can also be noted that the ratios are lower than the industry average (Brigham & Houston, 2009). This implies that the solvency of the company is lower than the industry average.
Profitability ratios
The company had an increase in the profitability ratios between 2011 and 2012. However, in 2013, the company reported a large drop in the value of the ratios. The operating margin fluctuated between 6.30% and 3.38%. The ratio estimates the profitability of the company after taking into account the operating costs. The profit margin declined from 4.42% in 2011 to 0.19% in 2013. The ratio measures the profitability of the company after taking into account both operating and non-operating activities of the company. The return on assets measures the profit generated from a unit of total assets. The ratio dropped from 5.66% in 2011 to 0.24% in 2013. This implies that the efficiency of the company in use of assets declined. Further, the basic earning power of the company varied between 4.36% and 8.07%. The ratios show that the ability of the company to generate operating profit from the assets declined. Finally, return on common equity declined from 16.07% in 2011 to 0.72% in 2013. The decline can be attributed to the decline in profitability and an increase in the shareholder’s equity. The ratios show that the amount of profit generated from the shareholder’s fund declined. The profitability ratios for 2011 and 2012 were higher than the industry average (Brigham & Houston, 2009). This implies that the company performed better than its peers during this period. However, in 2013, the ratios were lower than industry average. The decline in profitability in 2013 can be attributed to competition and change in consumer behavior as a result of the difficult economic conditions.
Market value ratios
Source of data – Tesco PLC, 2013
The price/earnings ratio gives information on the price of shares in relation to earnings. The ratio varied between 9.8 and 26.0. The value of the ratio in 2013 was higher than the industry average of 17.8. This implies that the shareholders anticipate higher returns on their investment. The market/book ratio gives information on the price of shares in relation to the book value of the assets. The value of the ratio ranged between 1.6 and 1.96. It can be noted that the ratios during the three year period was lower than the industry average. This may imply that the share of the company is undervalued. It may also indicate that the company is facing financial problems (Brigham & Houston, 2009).
Conclusion
The paper carried out financial analysis of Tesco PLC. The company operates in the United Kingdom’s retail sector. The company leads in terms of market share. Analysis of stock market activity indicates that the share prices of the company were quite volatile. Finally, the ratio analysis shows that the performance of the company was lower than the industry average.
References
Brigham, E., & Houston, J. (2009). Fundamentals of financial management. USA: Cengage Learning.
Tesco PLC. (2013). Tesco PLC annual report and financial statement 2013. Web.
Tesco PLC. (2014). About us. Web.