Abstract
Financial statements are an accumulation of reports of a firm’s monetary outcome, money-related condition, and cash flows. Budgetary statements signify a formal record of the money-related activities of an organization. These are composed of reports that measure the financial status, execution, and liquidity of an organization. Financial statements reveal the budgetary impacts of business investments in the organization
The paper discusses the importance of financial statements and reports. The users of financial reports were identified and discussed. Using Debenhams Plc as a case study, the financial ratios were calculated and analyzed. The ratios discussed include profitability, liquidity, and efficiency. Recommendations were made based on the company’s financial statement.
Introduction
Debenhams Plc is among the biggest clothing and textile retailers in the United Kingdom (Varley 2014). The organization started as a small franchise selling parasol, hats, and gloves (Debenhams PLC Annual Report & Accounts 2017). In 1813, the company changed its name to Clark and Debenhams. There was a hostile takeover by the Bruton Group, which affected the organization. However, the organization recovered its self-ruling when it “demerged” from the Burton Group to become the Arcadia Group plc. Debenhams stock was enlisted into the LSE in 2006 (Debenhams PLC Annual Report & Accounts 2016). This organization has over 240 stores across 27 nations. Debenhams is a global name in women’s clothing and the retail industry. The firm’s rivals include Tesco, Wal-Mart, and Sainsbury. It was found that the firm’s total assets rose to 2,800 in 2013 (Figure 1).
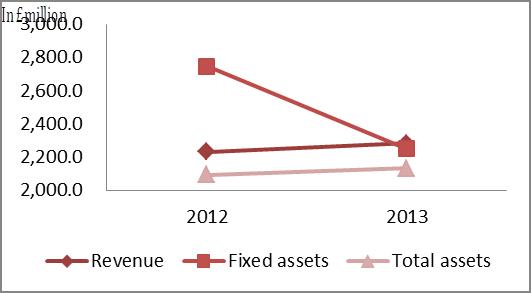 Revenues, Fixed & Total Assets | 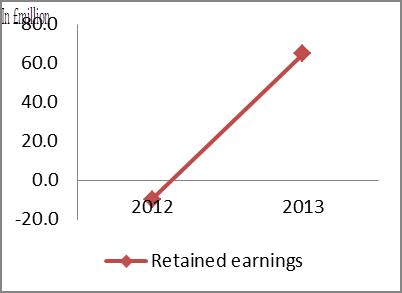 Retained Earnings |
Figure 1: Assets and Liabilities (Debenhams PLC Annual Report & Accounts 2016, p. 156).
Financial Reports and Statements
Budget articulation or financial statements are reports of a firm’s monetary outcome, financial condition, and cash flows. Budgetary statements signify a formal record of the financial activities of an organization (Aderemi 2017). These are composed of reports that measure the execution and liquidity of an organization. Financial statements reveal the budgetary impacts of business investments in the organization. In summary, financial information provides many opportunities. The importance of financial statements can be summarised below.
- To evaluate the capacity of an investment to generate income
- To decide if a business can repay its obligations
- To evaluate financial decisions and manage profitability issues
- To get financial ratios from the reports that show the state of the business.
- To research the points of interest of certain business investments, as described in the revelations that come with the announcements.
Financial specialists and potential investors are keen on their benefits and the security of their investment. As a result, income can be assessed from past execution as appeared in the financial report. The security of their business decision will be uncovered by the financial status of the organization as appeared in the balance sheet and budget position (Avakmovic & Avakumovic 2016). Thus, the users of financial statements include investors, market analysts or speculators, lenders, government agencies, employees, and customers.
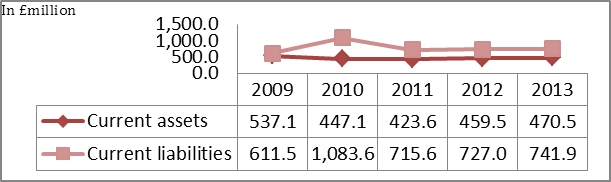
Workers and employees need to know whether a business can offer secure investments and conceivable pay rises. They will likewise have a distinct interest in the pay rates and wages of their management (Fabozz 2009). Information about productivity will likewise be valuable if the organization faces insolvency and bankruptcy. Loan specialists need to know whether they will be reimbursed when investment funds are released. By implication, loan institutions rely on the firm’s solvency ratio, which is covered by the financial statement. Financial institutions rely on the balance sheet to evaluate its assets and liabilities, which are vital variables for long-term loans. It was found that the firm’s assets and liabilities were stable in 2013 (Figure 2).
A government institution is another user of financial statements. Government agencies assess the economy and its policy interventions using financial records. Tax institutions use the financial statement to calculate the firm’s tax deductions or waivers (Francis, Terry & Steven 2013).
Investment suppliers use financial statements to make business decisions on supply and demand (Zentes, Morschett & Schramm 2011). By implication, outsourcing suppliers need to know whether they will be paid. Consequently, new entrants may require assurance concerning the financial status of the organization. Clients need to determine that an organization can sustain its product. This is valid if the client is relying on an organization for specific supplies. Finally, the speculators and the public may wish to evaluate the impact of the organization on the economy, local, and international environment. Please note that business rivals and competitors would likewise utilize financial statements and reports to make managerial and marketing monetary choices.
Comprehensive Income Statement
A comprehensive financial statement provides information for business analysis. It displays the firm’s performance and profit margin. This section of the paper will discuss the relevance of three financial ratios. The evaluation includes profitability, liquidity, and efficiency ratios. Debenhams finical records for four consecutive years will be used for this analysis.
Profitability Ratios
A firm’s profit margin can be evaluated by using its profitability ratios. In summary, the profitability ratio suggests the capacity to produce positive returns for the investors, which can be appropriated as profit, and some segments can be held for future operations. By implication, profitability ratios are the outcome of favorable and effective policy management. For an organization’s survival and expansion, profitability and productivity are fundamental. Therefore, Debenhams’s profitability capacity can be assessed using its profit ratio, gross ratio, and net profit ratio.
Debenhams’s Gross Profit Ratio
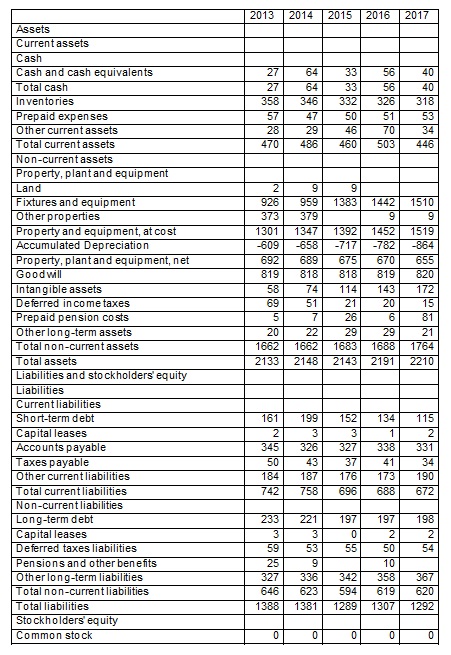
A firm’s gross profit is computed by taking a net profit. It uncovers the level of gross benefit accomplished by an organization on its net deals. The benefit produced from the immediate investment and operations is called the gross profit ratio. It is the essential estimation of the profit as there are some different elements, which may harm the benefit. Higher gross benefit prompts high profitability. It was found that the firm’s total cash dropped to 40 million in 2017 (Table 2).
The firm’s gross profit margin = revenue – cost of revenue / revenue.
Based on the analysis, it is discovered that the proportion of gross profit is expanding. The financial statement revealed a patterned value of 12.08, in 2014, 12.88 in 2015, 12.53 in 2016, and 11.34 in 2017. In summary, the high cost of sales accounts for its deteriorating gross profit ratio. The organization should reduce its cost of goods (revenue) to have a higher gross profit margin.
Debenhams’s Operating Profit
A firm’s operating profit is the balance of its revenue for that period. By implication, a deduction from the gross profit is called the operating profit ratio. To compute Debenhams‘s operating profit, total expenditures would be deducted from its gross profit. It was found that the firm’s net income dropped to 49 million in 2017 (Table 1).
The operating margin = the operating income / net sales.
The Debenhams operating margin was 5.56 in 2014, 5.77 in 2015, 5.06 in 2016, and 3.05 in 2017. The value shows deteriorating revenue before tax and interest. This approach is more appropriate than the gross ratio as the results are more accurate. Based on its financial statement for the fiscal year, Debenhams has a lower operating profit. Low gross profit and poor management influence the outcome.
Net Profit Ratio
The most used measurement for estimating a firm’s income is the net profit. Net profit is accumulated after deducting all the costs of operations during a fiscal year. The cost of operations includes all direct and indirect expenditures accrued during one financial year.
Net profit margin = profit /revenue
The company’s net profit margin was 3.77% in 2014, 4.03% in 2015, 3.67% in 2016, and 2.09% in 2017. Based on these assumptions, Debenhams‘s net profit shows poor financial strength. As a result, its dividend rate is deteriorating.
Liquidity Ratios
A firm’s liquidity ratio describes its ability to meet all financial obligations. By implication, Debenhams’s liquidity ratio demonstrates the management’s capacity to pay for its operating cost. Therefore, liquidity is fundamental for the efficient running of a business (Weribgelegha & Egoro 2017). If the organization has poor liquidity, it would be difficult to manage credit facilities over a short and long-term investment. A firm’s liquidity ratio can be assessed using its quick and current ratios.
Debenhams’s Current Ratio
A firm’s current ratio is the proportion between the present resources and current liabilities. Both assets and liabilities are the fundamental elements of the working capital. The current ratio describes the firm’s capacity to settle its liabilities
Current ratio = current asset/ total liabilities
Debenhams’s current ratio was 0.64 in 2014, 0.66 in 2015, 0.73 in 2016, and 0.66 in 2017. Debenhams’s current ratio shows a negative value as the present proportion falls below one. It implies the organization has more liabilities to pay than its assets (Graham, Smart & Megginson 2012).
Debenhams’s Quick Ratio
The quick ratio is the extent between liquid assets and liabilities. Items that are not changed into fluid money are deducted from the firm’s assets and liabilities.
The quick acid ratio formula = asset – inventory/ liabilities
Its quick ratio was 0.12 in 2014, 0.09 in 2015, 0.13 in 2016, and 0.1 in 2017
Based on its financial report, Debenhams’s quick ratio was 0.1 in 2017, which demonstrates a liquidity crunch (Robinson et al. 2015).
Efficiency Ratios
A firm’s efficiency ratio is evaluated using a standard measurement. By implication, the efficiency ratio is any value over the normal measurement. As a result, the organization creates a standard measurement or indicator for its operations.
Receivable Turnover
Receivable turnover is the time permitted to account holders for paying off their duty. The receivable turnover can be computed by dividing credit deals by income received.
Receivable turnover ratio = Total Credit sales/Average accounts receivable
The firm’s turnover was 102.56 days in 2014, 92.54 in 2015, 90.24 in 2016, and 85.69 in 2017. Based on the assumptions, Debenhams takes 86 days to reimburse business debtors in 2017. This ratio reveals how effective the organization can meet its financial obligations.
Asset Turnover Margin
Asset turnover proportion is a productivity proportion that measures an organization’s capacity to create deals from its assets by contrasting net deals and aggregate resources. In summary, a firm’s asset ratio proportion demonstrates how an organization can utilize its resources for creating deals. Asset turnover was 1.08 in 2015, 2015, and 2016. The firm’s asset turnover was reduced to 1.06 in 2017.
Inventory Ratio
A firm’s inventory ratio computes the raw materials expended for a specific year and the leftover segment. It is a critical component of a firm’s resources. In most business investments, an extensive sum is locked for emergencies. The inventory ratio estimates the recurrence of stock cleared during a productive year. Debenhams’s inventory turnover was 5.78 in 2014, 5.89 in 2015, 6.23 in 2016, and 6.43 in 2017.
Conclusions and Recommendations
As demonstrated in the present analysis ratios, Debenhams’s liquidity ratio is below average, suggesting the organization cannot meet money-related commitments. The organization would money-related challenges as banks and lending institutions may not provide credit facilities for short-term investments. To maintain a strategic distance from these conditions, it is prudent for Debenhams Plc to build their assets, through equity issuance. Besides, the organization has a higher profitability ratio, which indicates the effective allocation of assets. Nevertheless, the company’s liquidity ratio is deteriorating. However, the firm is effective in overseeing its assets to generate income. The company is efferent in settling financial obligations to creditors and shareholders. As a result, the company is effective in debt management from clients and customers.
Based on its gearing ratio, the business environment is challenging because of the diminishing capacity to cover its interest commitments. This analysis reveals that the firm’s assets are procured using loan facilities. Along these lines, the organization should attempt to diminish the debt profile because a high debt ratio expands obligation load. From the above estimations, Debenhams Plc should focus on expanding its income since they incur huge financial obligations from direct and indirect expenditures. The firm’s ratio analysis shows inadmissible conditions except for the profitability ratio, thus the organization should conduct an audit analysis of its operations. The overall financial statement is positive, however, the organization should attempt to discover new investments, which will upgrade its turnover ratio and interest ratio. Debenhams Plc should attempt to use its competitive advantage and competencies in women’s clothing to sustain its presence in the industry. The organization has a decent receivable and payable administration’s approach.
Reference List
Aderemi, A 2017, ‘Financial reports and shareholders’ decision making in Nigeria: any connectedness? Journal of Internet Banking and Commerce, vol. 22, no. 8, pp. 1-14.
Avakmovic, J & Avakumovic, J 2016, ‘Method of financial analysis and impact on quality of decision making’, EuroEconomica, vol. 35, no. 2, pp. 17-19.
Cho, s & Kang, S 2017, ‘The effect of accounting information quality and competition on investment inefficiency: evidence from Korea’, Asia-Pacific Journal of Accounting & Economics, vol. 1, no. 1, pp. 4-13.
Debenhams PLC DBHSF: balance Sheet 2018, Web.
Debenhams PLC DBHSF: income statement 2018, Web.
Debenhams PLC Annual Report & Accounts 2016 2016, Web.
Debenhams PLC Annual Report & Accounts 2017 2017, Web.
Fabozz, F 2009, Institutional investment management: equity and bond portfolio strategies and applications, John Wiley & Sons, London.
Francis, G, Terry, G, & Steven, T 2013, International bibliography of business history, Routledge, London.
Graham, J, Smart, S, & Megginson, W 2012, Introduction to corporate finance, Cengage Learning, Australia.
Robinson, T, Henry, E, Pirie, W & Broihahn, M 2015, International financial statement analysis, Wiley, Hoboken.
Varley, R 2014, Retail product management: buying and merchandising, Routledge, London.
Weribgelegha, A & Egoro, S 2017, ‘Financial ratios as a veritable tool for investment decision making in an organization’, Journal of Finance, Banking and Investment, vol. 4, no. 1, pp. 1-8.
Zentes, J, Morschett, D & Schramm, K 2011, Strategic retail management: text and international cases, Gabler, Wiesbaden.
Appendices
Table 1: Debenhams Plc Income Statement. (Morningstar 2018, p. 4).