Introduction
For this week’s assignment, the stock prices of Tesla are reviewed using Yahoo’s Finance service. Tesla is a United States-based company that works in the industry of electric car manufacturing construction and is one of the companies owned by Elon Musk. Tesla is a great company, both because it entered a challenging sector of auto manufacturing and because of its CEO. Musk has other successful projects, such as SpaceX, which partners with NASA and has built and launched several successful rockets that use new technology, allowing these rockets to return to earth. From a business perspective, Tesla is a risky investment because the company is unique to the industry that has a set of established players (“Tesla, Inc.,” n.d.). However, based on the stock prices, which are showing a steady increase over the past year, Tesla is worth investing in since, in the long-term, the company can generate a substantial profit for the stockholders. This paper will analyze Tesla’s stock prices over the past year using visual methods and descriptive statistics and will explain how the analysis was conducted.
High Daily Stock Prices
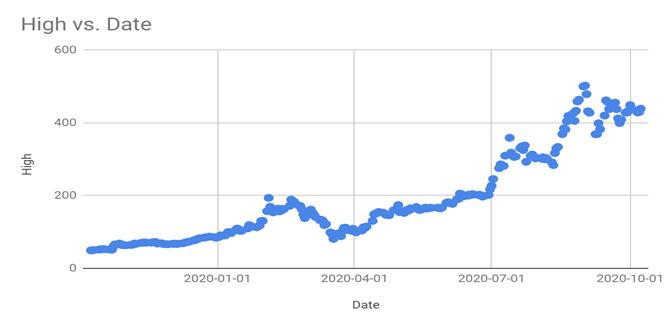
The data of Tesla’s daily stock prices within the last year was obtained from Yahoo Finance’s website (“Tesla, Inc. (TSLA),” n.d.). The results of figure 1 show a positive relationship between the high daily stock prices and time. This implies a steady progressive increase in high daily stock prices and A positive effect on the company’s liquidity.
Low Daily Stock Prices
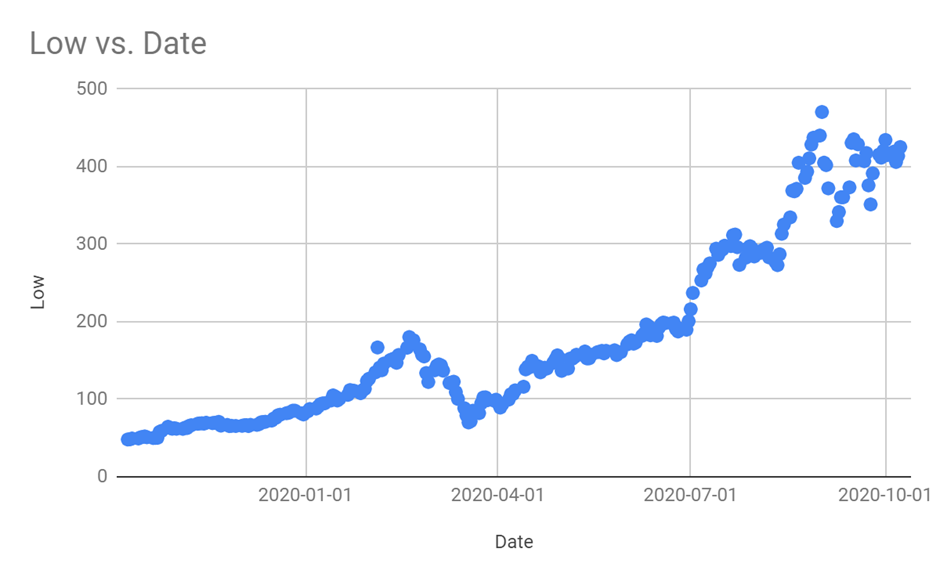
The outcomes in figure 2 also depict a moderately negative relationship between the low daily stock prices and time. The 20 percent deviation from the high stock prices implies that Tesla has a peak trading range for investors. This result also suggests a positive effect on the company’s liquidity.
Histogram of Adjusted Closing Stock Price
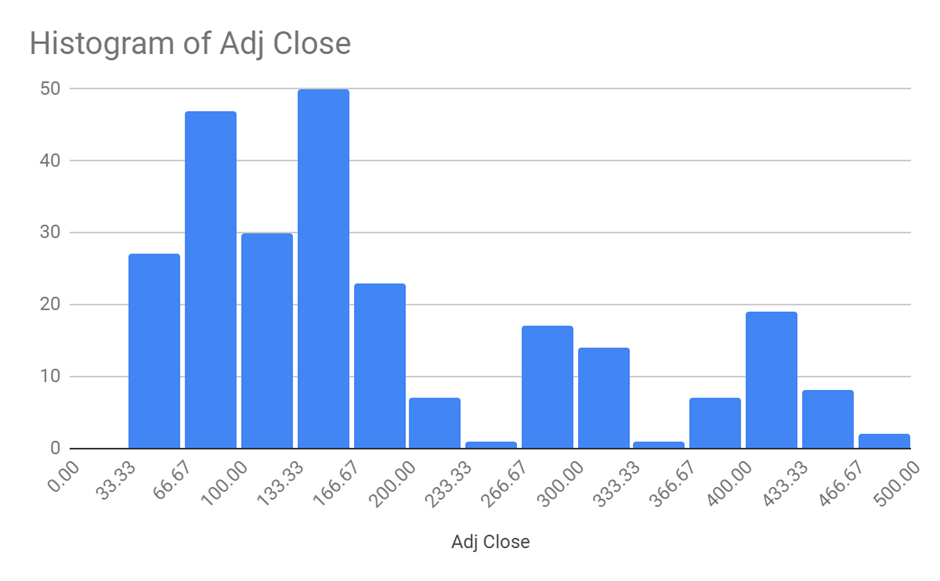
The x-axis shows the ranges of the adjusted closing stock prices and the y-axis shows the number of occurrences of prices falling within the ranges of The adjusted closing stock prices. The histogram is almost bell shaped which means the data points are evenly distributed in the ranges of the daily adjusted closing price. Considering the symmetric distribution of the data, the mean and the median are approximately equal to each other which indicates predictable daily closing stock prices for Tesla.
Histogram of Stock Trade Volume
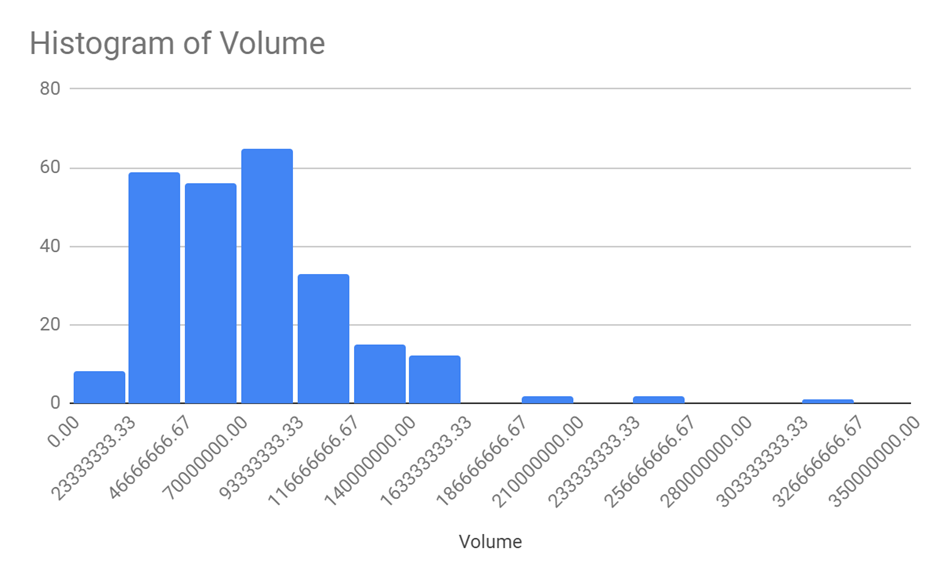
The x-axis shows the ranges of volume and the y-axis shows the number of occurrences of stock volumes falling within the range. The histogram is strongly skewed to the right implying mean is higher than the median. With the majority of the data points falling within the lower range of stock, volume represents unequal distribution and challenges to estimate the daily stock volume for Tesla.
Conclusion
Overall, the graphical representations of Tesla’s stock history represent the company’s needs to react to its upcoming competitors and provide more unique product and service. The stock trends show gradual decrease in stock prices and we are seeing slight recovery of the stock price in the last quarter. The results depict a steady business growth and fully recovered investor confidence. While remaining optimistic, a long-term strategy that will grow revenue in the coming years and establish public confidence is still developing. However, investment in Tesla is a long shot since due diligence has to be assessed the current stock price against projected profitability forecasts. From the analysis of Tesla, it is worth to invest in the company, since the stock prices are favorable; therefore, an investor does not need to consider investing in stock of other companies.
Reference
Seigel. (2019). Trading volume: What it reveals about the market. Web.
Tesla, Inc. (n.d.). Britannica. Web.
Tesla, Inc. (TSLA). (n.d.). Yahoo Finance. Web.