For this week’s assignment, the stock prices of Tesla are reviewed using Yahoo’s Finance service. Tesla is a United States-based company that works in the industry of electric car manufacturing construction and is of the companies owned by Elon Musk. Tesla is a great company, both because it entered a challenging industry of auto manufacturing and because of its CEO. Musk has other successful projects, such as SpaceX, which partners with NASA and has built and launched several successful rockets that use new technology, allowing these rockets to return to earth. From a business perspective, Tesla is a risky investment because the company is unique to the industry that has a set of established players (“Tesla, Inc,” n.d.). However, based on the stock prices, which are showing a steady increase over the past year, Tesla is worth investing in since, in the long-term, the company can generate a substantial profit for the stockholders. This paper will analyze Tesla’s stock prices over the past year using visual methods and descriptive statistics and will provide an explanation of how the analysis was conducted.
Tesla is a relatively new company, which was established to create efficient electric cars, which would be comfortable and offer decent miles per charge ratio since the market did not have an electric vehicle that could compete with petrol or diesel before Tesla. Created in 2003 by two entrepreneurs from the United States, and in 2008 Musk became the CEO (“Tesla, Inc,” n.d.). In the same year, the company presented its first sports car, the Roadster. Since then, Tesla’s engineering developed several fully electric vehicles that are available to consumers. Hence, this is a potentially prospective business, since Tesla offers innovative solutions and has caused a disruption in the market of vehicles.
Graphical Representation of Data
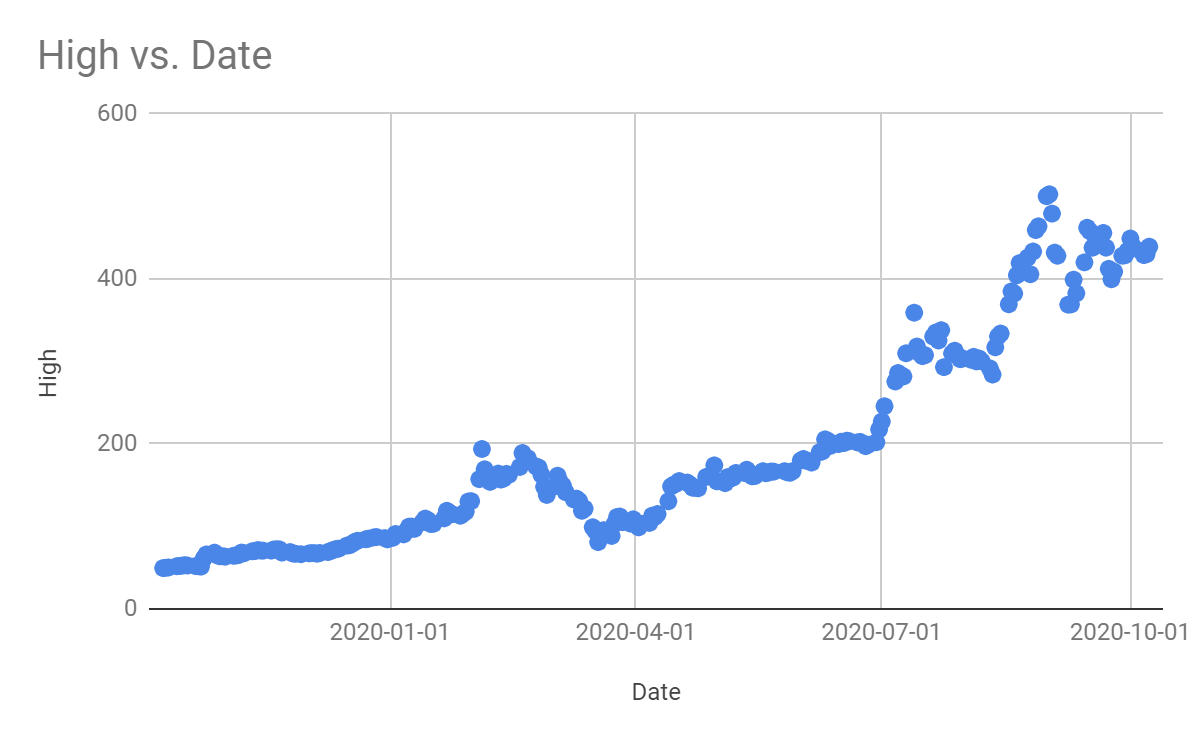
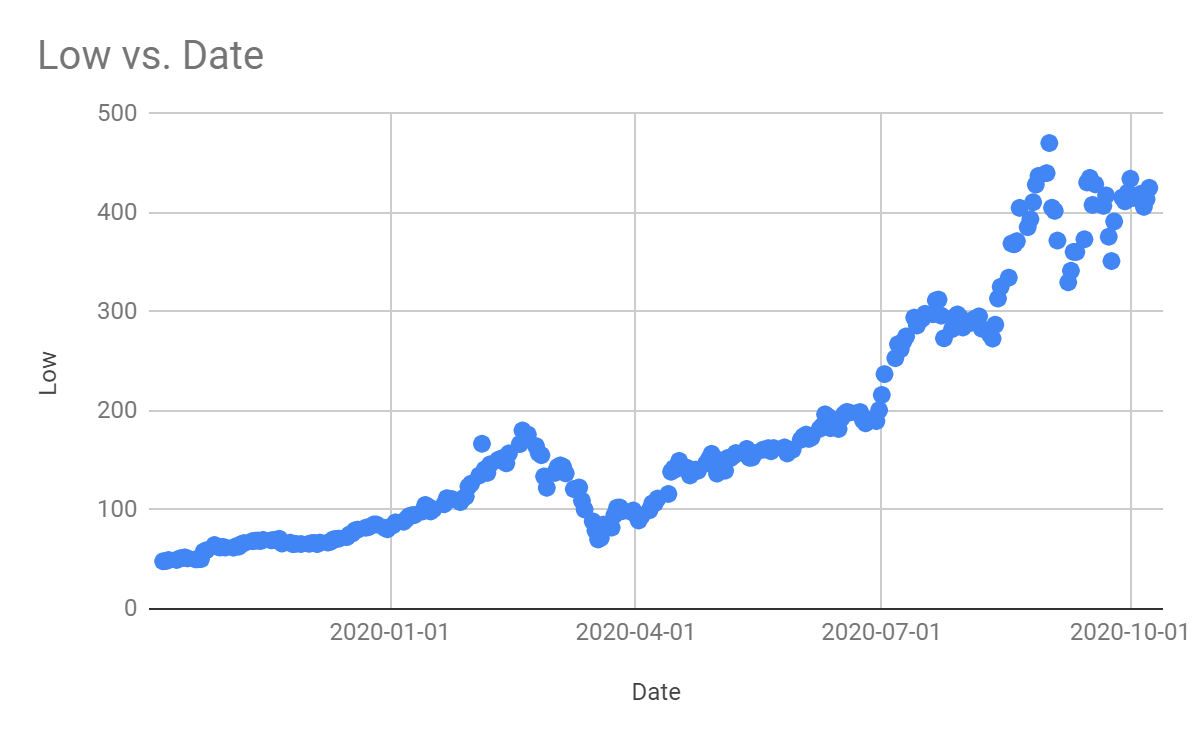
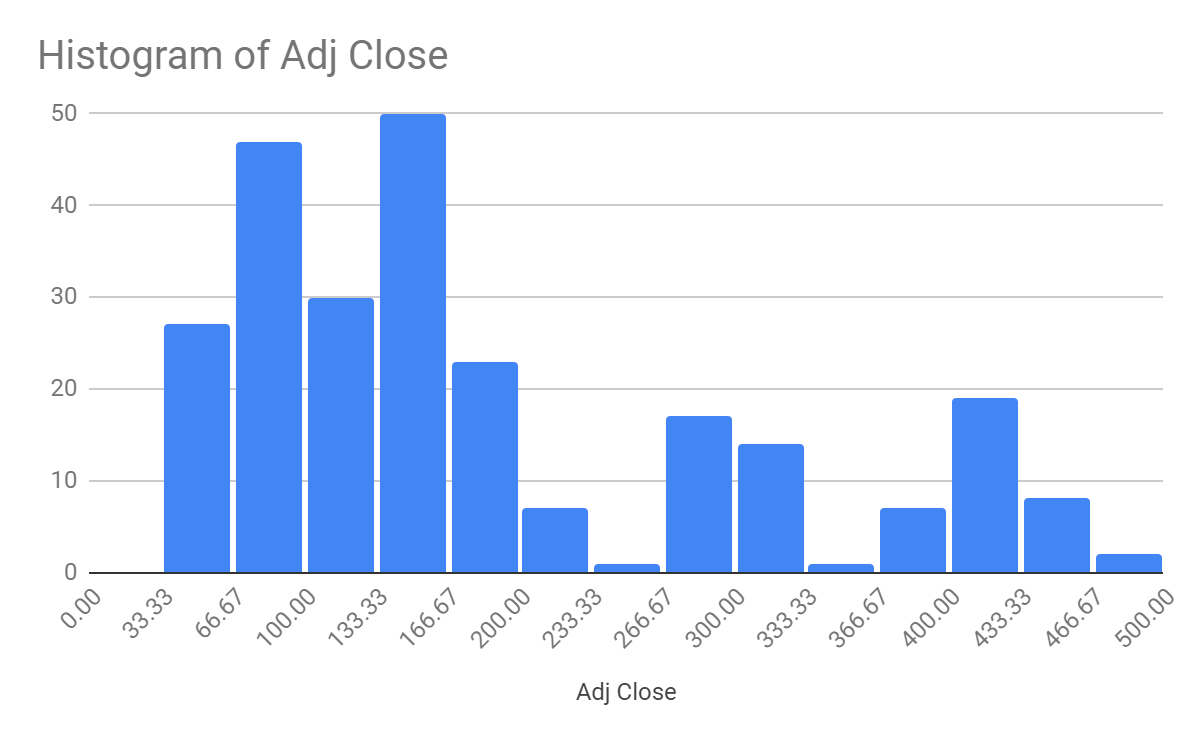
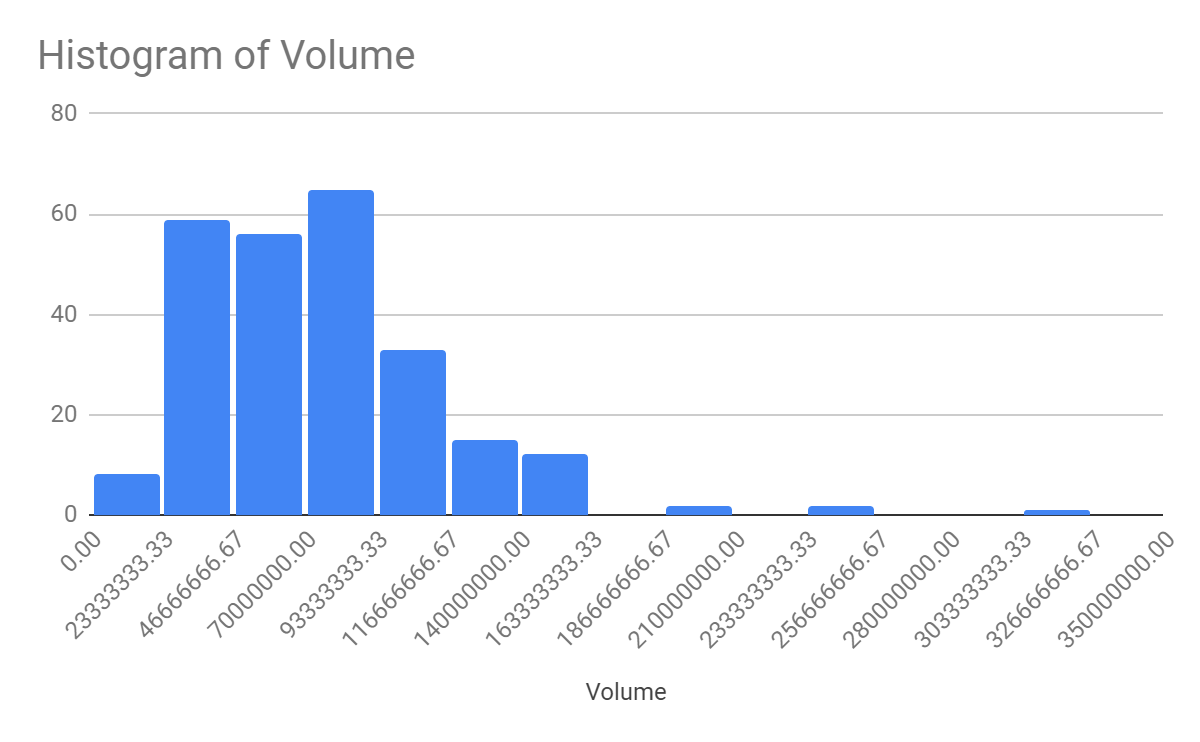
The data on Tesla’s daily stock prices within the last year was obtained from Yahoo Finance’s website (“Tesla, Inc. (TSLA),” n.d.). The information about the stock prices within the last year was selected using the filters and downloaded as an Excel spreadsheet. Next, the author of this paper used Exel’s built-in functions to create graphs and analyze the data. Figures 1-4 depict the visual representations of Tesla’s stock price analysis. The scatterplot shown in Figure 1 was made by selecting the columns “Date” and “High” and clicking the “Scatter” button in Excel. Similarly, Figure 2 or the scatterplot of the lowest prices was created by selecting the columns “Low” and “Date” and choosing the scatterplot option. Hence, both scatterplots were created using the same function and selecting different data sets as the base for the graph. The histogram in figure 3 was created using Excel’s option “Insert” choosing “insert statistics chart” and selecting a histogram as a type of a chart. A similar process was used to create figure 4 was made, and in both cases, the bin size was adjusted automatically.
Descriptive Statistics
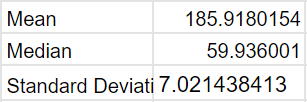
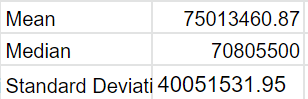
Next, the author used the same data set to apply built-in functions and determine some of the characteristics of the data set using descriptive statistics. Descriptive statistics allow summarising the data sets by describing its core characteristics (“Descriptive statistics,” n.d.). The mean, median, and standard deviation for the adjusted daily stock price were created using the following formulas: “AVERAGE,” “MEDIAN,” and “STDEV.” For the “adjusted closing price,” the data range of F2 to F254 was selected, and to calculate these values for “stock volume,” G2 and G254 fields were chosen, as presented in Tables 1 and 2. The author typed in the name of the function that allows performing the calculations, followed by “(),” where the data range was cited. The standard deviation allows determining the dispersion of this data range, the median can be used to describe the middle number from the given data set, and calculations of the mean allow determining the central tendency (“Descriptive statistics,” n.d.). In comparison, the first data set is far less dispersed when compared to the second, since its standard deviation is seven as opposed to 40051531.
Overall, this paper is an analysis of Tesla’s stock prices over the last year. This essay presents graphical representations of the stock prices using scatterplots and histograms, as well as calculations of the descriptive statistics. Graphs 1 and 2 re scatterplots of the highest and lowest stock prices for each day. Graphs 3 and 4 are histograms representing volume and adjusted closing prices. Based on the graphs, one can conclude that Tesla’s stock price has been steadily increasing over time. In addition, descriptive statistical methods were used to calculate the the averedges and dispersion for this data set.
References
Descriptive statistics. (n.d.). Web.
Tesla, Inc. (TSLA). (n.d.). Web.
Tesla, Inc. (n.d.). Web.