Data Analysis Plan
This paper used two types of variables, the manipulation of which was expected to lead to specific results. The first of these was a gender characteristic of students: choosing only two discrete values determined the categorical essence of the present variable. The categorical variable was also the student’s previous GPA. It was interesting to determine if there was a gender and prior experience-associated relationship in obtaining current scores. The null hypothesis was that the mean of the current exam scores for the two gender samples was identical, whereas the alternative hypothesis set the numbers unequal. Consequently, the overall question of the experiment was to determine the extent to which the respondent’s gender characteristics influenced the score.
Testing Assumptions

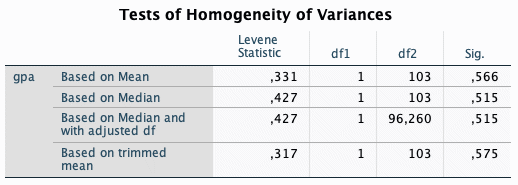
For the Levene’s test, it was assumed that both samples have the same variance, which was the null hypothesis. Since the obtained result p-value was higher than the threshold of significance (>0.05), the null hypothesis was accepted and, consequently, the assumption of the equality of variance of samples was relevant.
Results & Interpretation


The above tables reflect the results of the descriptive statistics and t-test for the two samples used. Assuming that the variances were equal, an extremely high p-value (0.566) can be seen, which means that the null hypothesis is accepted and the independent results of Levene’s test are confirmed. Consequently, the mean GPA score among women and men was identical and statistically indistinguishable.
Statistical Conclusions
The test conducted showed no statistically significant difference in the test scores for students of the two genders. This is essential information, showing that it is impossible to label one gender as smarter than the other overall. This is useful for a sound university organizational policy. However, the experiment was only done on a population of students from the same institution may impose limitations on scalability.
Application
In future professional settings, similar data can be used for gender analyses to identify potential patterns. For example, gender as an independent variable may or may not affect athletic (running speed), political (electoral rating), or economic (income size) variables. This kind of research provides a deeper understanding of the sociological nature of gender differentials.