Liverpool and Manchester Contrasted
Introduction
Crime has always been one of the most serious issues that the human society has ever faced. During the centuries of its history, the mankind has been trying to eliminate and fight crime, but the research results by various scholars prove that the outcome of the eternal struggle with crime are not as positive as one might have hoped. Accordingly, in the modern world the issue of crime is also under the great public scrutiny (Easton, 2010). England, as one of the highly developed countries, could have been considered as a safe country, but the statistical data illustrate the point that crime rates in England remain rather high, if contrasted with other countries, although the period of 2000-2008 have seen an essential decrease of crime rates in various cities of England.
Basic Notions of Crime Statistics
Accordingly, the current paper focuses on the comparative analysis of crime rates observed in such English cities as Liverpool and Manchester over the period between 2000 and 2008. The report will consider such crime types as violence against personality, sexual offence, robbery, burglary, offence against vehicles, theft, fraud and forgery, criminal damage, drug offences, etc (Home Office, 2010). First, each of the cities under analysis, i. e. Liverpool and Manchester, are analyzed according to the crime rates observed in them between 2000 and 2008. Such factors are taken into special consideration as the mean, mode, median, standard deviation, and variance of the rates observed (Dobbs and Miller, 2004, p. 11). Second, the comparative analysis of the data from both cities is presented. Finally, the results of the analysis are formulated into a logical conclusion to this statistical report.
Crime Statistics in Liverpool
Mean, Mode, and Median
The consideration of crime rates in Liverpool between 2000 and 2008 can be started with stating that the occurrence of various crime types in this city is rather low compared to the data from Manchester. According to the data by the Home Office (2010), 81,109 cases of various crimes were recorded in Liverpool between 2000 and 2001, while the period of 2001 – 2002 saw the decrease to 78, 893 cases. The dynamics of crime rate decrease in Liverpool from 2002 till 2008 is illustrated by the following graph using the respective quintile from 20.0 to 474.1 (Home Office, 2010):
There is no mode for these figures as none of them occurs more than once. The mean (M1), and median (M2) for the Liverpool quintile are 158.6 and 181.5 respectively. This means that the crime rate in Liverpool was higher than the mean for its quintiles for all years starting from 2000 and up to 2006.
The fact that in 2006, the actual crime rate became even lower than the mean proves that the measures taken by the government to reduce crime levels started giving their results and the overall situation in the society changed for the better. The point that the median of the Liverpool crime rate is the highest point for all years considered illustrates the point that 2005 was the time of the greatest increase of crime levels in the city (EU and Merseyside, 2006, p. 11).
Standard Deviation and Variance
At the same time, the meanings of the standard deviation and variance of crime rates for Liverpool show the crime situation in the city has always been on its way towards getting better, even in 2005, when the quintile of Liverpool crime rates reached its peak in the period between 2000 and 2008, i. e. the meaning of 181.5. To prove this, let us first take a look at the standard deviation, which is 22.1 for Liverpool data. This is a rather large deviation, and this evidences that crime rates in the city changed drastically every year during the discussed period.
The variance with the meaning of 487.2, which is also a rather large figure, illustrates this point as well. But the positive point is that the standard deviation is the closest to the average one in the year when the actual crime rates were the highest in Liverpool. This fact has three major meanings:
- Crime rates in Liverpool changed unpredictably between 2000 and 2008;
- 2005 was the year when scholars managed to predict the deviation with the greatest degree of precision;
- Scholarly projections were worse than actual crime rates for the major part of the period of 2000 – 2008.
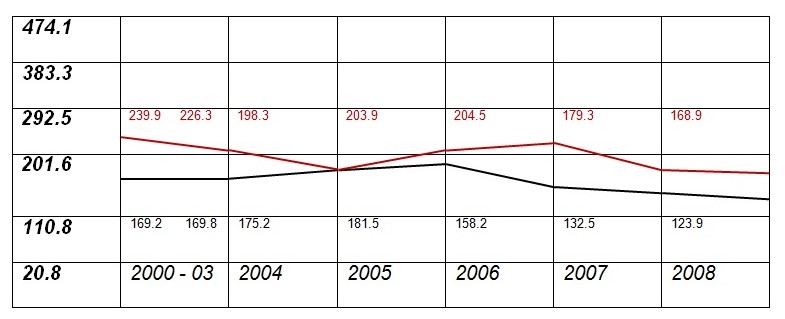
To illustrate the relation of the actual quintile meanings, deviations, and the standard deviation for Liverpool crime rates, Graph 2 can be used. In this graph, the black line shows the actual quintile meanings, while the red line marks the deviations that the figures for Liverpool crime rates demonstrated after carrying out their statistical analysis:
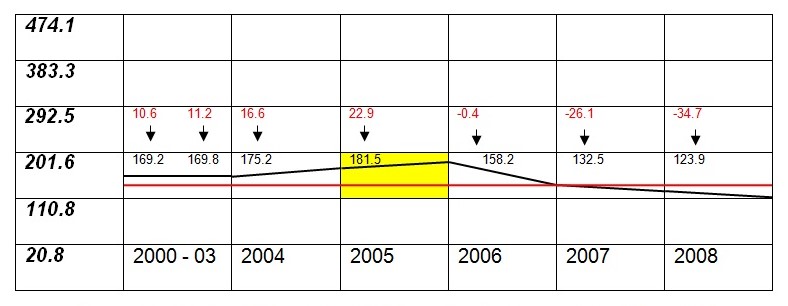
Accordingly, Graph 2 illustrates that the actually observed deviation of the crime rate from the mean predicted by scholars was the closest to the standard deviation in 2005, as the deviation at that point was 22.9, while the standard deviation is 22.1. Considering also the fact that quintile observed in 2005 was also the median for the crime rates discussed, one can see that scholars provided the most precise expected data for 2005, and after this point, Liverpool crime rates started declining even below the expected mean of 158.6.
Crime Statistics in Manchester
Mean, Mode, and Median
The data presented by the Home Office (2010), Povey et al. (2000), and Nicholas et al. (2007) show that the crime rates in Manchester were always higher than in Liverpool between 2000 and 2008. For instance, if the rate of all crimes recorded in Manchester is considered, it becomes obvious that in 2000 and 2001 the city saw 96,832 and 95,213 crime cases respectively. The more detailed picture of Manchester crime rates between 2000 and 2008 can be seen from Graph 3, in which these rates are presented in the form of quintiles (ranging from 20.0 to 474.1) reflecting the average occurrence of crimes at the given period of time (Home Office, 2010):
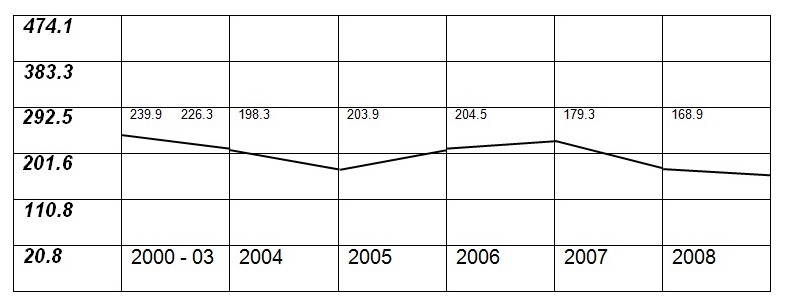
There is no mode for these figures as none of them occurs more than once. The mean (M1), and median (M2) for the Manchester quintile are 203.0 and 203.9 respectively. As one can see, the mean and the median are rather close, which shows that the scholarly projections regarding crime rates in Manchester were rather close to the actual levels observed between 2000 and 2008.
Standard Deviation and Variance
Further on, the standard deviation and variance of crime rate meanings for Manchester show that the crime levels in the city are more dangerous than in Liverpool, and that the dynamics of those rates’ change is even more drastic in Manchester than in Liverpool. There can be two major explanations to the fact that the standards deviation is so large, 24.7, and the variance is even larger, 609.0.
The first way to explain the situation is that the scholarly projections for crime rates in Manchester were quire far from the real situation in the city. As well, this can be explained by the fact that the crime rates changed dramatically, and without obvious conditions for that. It can be assumed that drastic changes in social life, levels of wellbeing, etc. conditioned such a crime rate dynamics in Manchester.
The detailed illustration of quintile – deviation relations is presented in Graph 4:
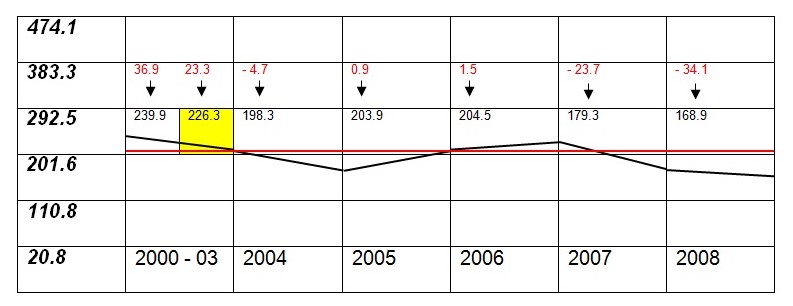
Thus, Graph 4 shows that the actual deviation was the closest to the standard one 24.7 in 2003, when it amounted to 23.3. After this, crime rates in Manchester declined, than grew, and then started declining again in 2007.
Comparative Analysis
Accordingly, the above findings for Liverpool and Manchester allow carrying out a comparative analysis. First of all, it is obvious, although the reasons are not seen from statistical calculations, that the crime rate in Manchester was always higher than in Liverpool between 2000 and 2008. Even considering the fact that 2000s saw the decline in England’s crime rate on the whole, one could see that the declining rate of crime in Liverpool was lower than the one in Manchester:
On the basis of this main difference, all other statistical meanings for crime rates in Liverpool and Manchester are different. Thus, the mean for Liverpool is 158.5, while for Manchester it is 203.0, and the median is 181.5 and 203.9 respectively. The standard deviation for Liverpool equals 22.1 and the same factor for Manchester is 24.7. Finally, the variance figures are 487.2 and 609.0 for Liverpool and Manchester respectively. These figures allow arguing that the only three similarities between the crime rates in these two cities include the close mean figures (22.1 and 24.7), the absence of modes for the quintiles, and the fact that crime rates in both Liverpool and Manchester started declining between 2000 and 2008.
Conclusions
Thus, the above presented discussion allows concluding that the crime rates in England have been declining since the early 2000s. The comparative analysis of data for Liverpool and Manchester reveals, although the latter still has higher crime rates, both cities see the reduction of crime occurrences. The period between 2000 and 2008 proves to be the beginning of success in fighting crime in England. At the same time, statistical data show that the crime rate in Manchester is a serious problem that demands an urgent solution to be found.
Works Cited
Dobbs, Steve and Jane Miller. Statitics1(Cambridge-Advanced Mathematics). Cambridge University Press, 2004. Print.
Easton, Mark. Tory crime statistics row deepens. BBC News, 2010. Web.
Home Office. England Crime Rates. Instant Atlas, 2010. Web.
EU and Merseyside. Merseyside Objective One Program. European Funding, 2006. Web.
Nicholas, Sian et al. “Crime in England and Wales 2006/07.” Home Office Annual Bulletin 4.00 (2007): 193 pages. Web.
Povey, David et al. “Recorded Crime Statistics: England and Wales” Home Office Annual Bulletin 12.00 (2000): 43 pages. Web.