Histograms
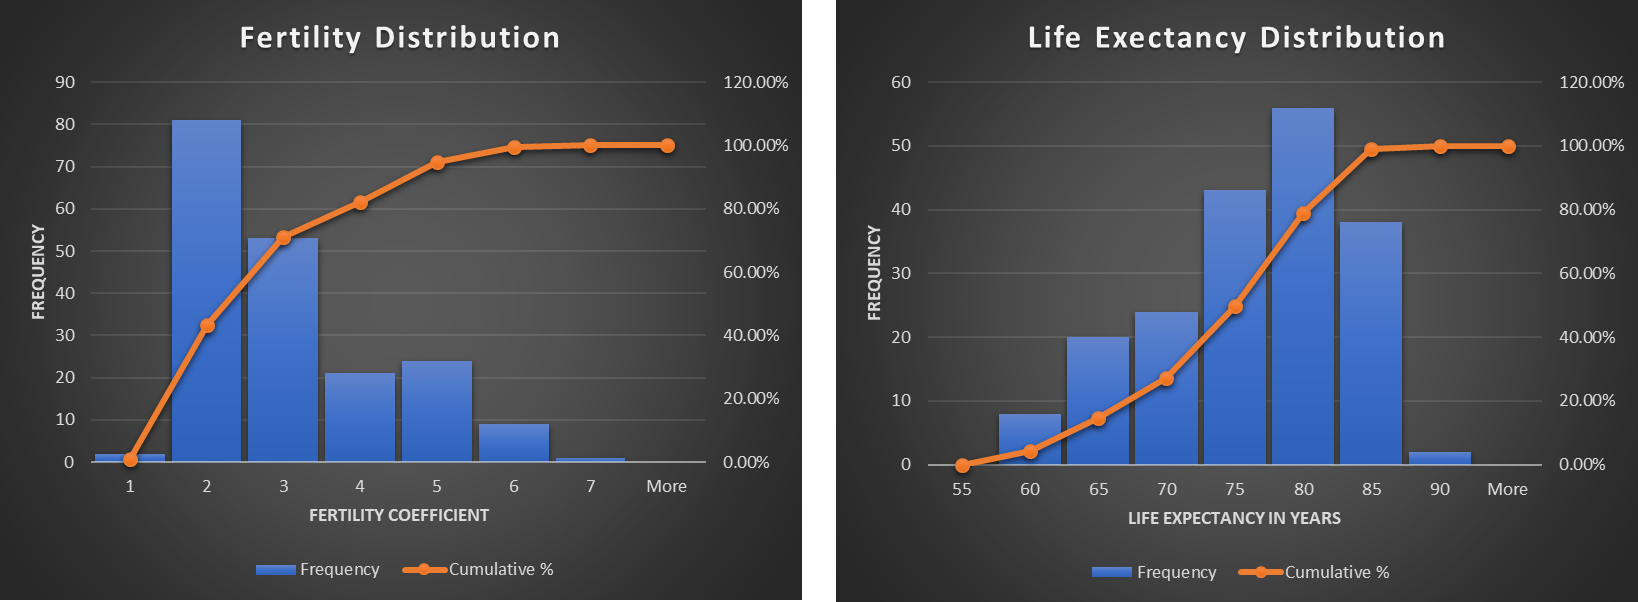
Descriptive Statistics
The provided dataset had two variables, including 2019 fertility and 2019 life expectancy with 191 entries. The mean value of 2019 fertility was 2.64, with a standard deviation (SD) of 1.24. The median value of fertility was 2.2, which implies the distribution curve will be skewed to the right. This was confirmed by the positive skewness coefficient. The distribution of fertility varied between 0.9 and 6.8. The mean value of 2019 life expectancy was 73.81 years, with an SD of 7.12 years. The median life expectancy was 75.01, which implied that the distribution curve was skewed to the left. This was confirmed by a negative skewness coefficient.
Predicting Life Expectancy
Scatterplot
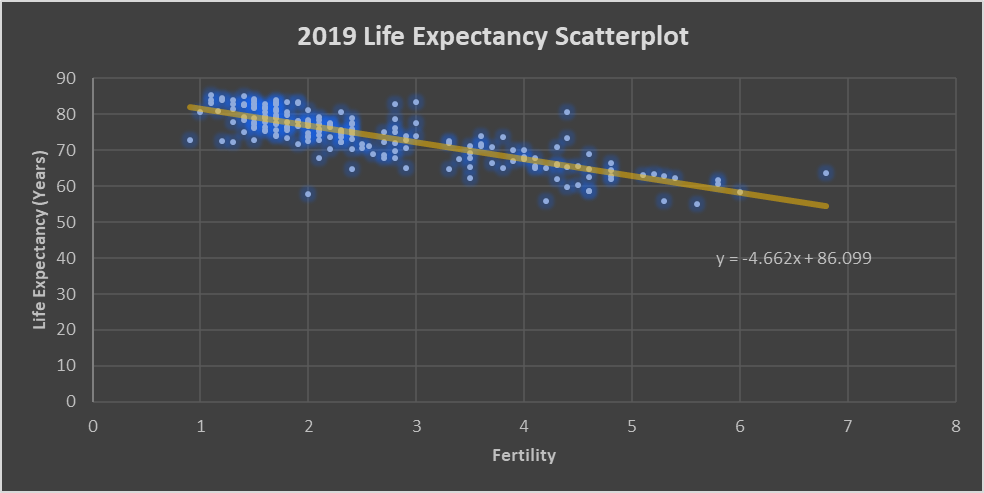
Regression Equation

The equation demonstrates that with an increase of average fertility of the country by 1, the average life expectancy decreases by 4.7 years.
Coefficients
Coefficient of determination (R2) = 66.36%. The coefficient demonstrates that 66.36% of the variability of the dependent variable can be predicted by the variability in the independent variable.
Pearson’s r = -0.815. This coefficient demonstrates a very strong negative correlation.
Prediction
The average fertility of the US is 1.7. This implies that, according to the equation, the life expectancy of the country should be the following:

Thus, the predicted life expectancy for the US is 78.17 years, while the actual life expectancy of the US in 2019 was 79.11. Thus, there was an error in the prediction of 0.94 years.
Additional Discussion and Thoughts
Lurking Variables
The possible lurking variable in here is average family income. The fewer children a family has, the more it has time to work and the less it has to spend on children. Thus, average income per family member increases, which allows additional expenditures on health. The higher the expenditures on health, the higher the life expectancy. Thus, the possible lurking variables are average family income, average individual income, and health expenditures.
Correlation and Causation
Causation implies that changes in one variable serve as the reason for the changes in the other. Correlation implies a relationship between two variables; however, a change in one variable does not serve as the reason for the change in another. We cannot say that there is a cause-effect relationship between the two variables in this model. First, there is no logical explanation for that. Second, regression analysis does not test for a cause-and-effect relationship.
Predicting the Life Expectancy of an Individual
The regression model cannot be used to predict the life expectancy of an individual, as the variables do not consider the life expectancies of individuals. The variable concerns average life expectancies in the country.
Fertility and Life Expectancy through Time
If we had taken the data from an earlier period, we would have seen a very different correlation. It appears that the bubble chart started to shape as a downward line only in the 1970s. Before that time, the correlation was not so obvious. As time went on, life expectancy was growing while fertility was dropping. However, it appears that life expectancy grew before the fertility rates dropped. This may be explained by the development of healthcare.